
ADS7042
Ultra-Low Power, Ultra-Small Size, 12-Bit, 1-MSPS, SAR ADC
ADS7042 Ultra-Low Power, Ultra-Small Size, 12-Bit, 1-MSPS, SAR ADC
1 Features
1• Industry's First SAR ADC with Nanowatt Power Consumption:
– 234 µW at 1 MSPS with 1.8-V AVDD
– 690 µW at 1 MSPS with 3-V AVDD
– 69 µW at 100 kSPS with 3-V AVDD
– Less than 1 µW at 1 kSPS with 3-V AVDD
• Industry's Smallest SAR ADC:
– X2QFN-8 Package with 2.25-mm2 Footprint
• 1-MSPS Throughput with Zero Data Latency
• Wide Operating Range:
– AVDD: 1.65 V to 3.6 V
– DVDD: 1.65 V to 3.6 V (Independent of AVDD)
– Temperature Range: –40°C to 125°C
• Excellent Performance:
– 12-Bit Resolution with NMC
– ±1-LSB (Max) DNL and INL
– 70-dB SNR with 3-V AVDD
– –80-dB THD with 3-V AVDD
• Unipolar Input Range: 0 V to AVDD
• Integrated Offset Calibration
• SPI™-Compatible Serial Interface: 16 MHz
• JESD8-7A Compliant Digital I/O
2 Applications
• Low-Power Data Acquisition
• Battery-Powered Handheld Equipment
• Level Sensors
• Ultrasonic Flow Meters
• Motor Control
• Wearable Fitness
• Portable Medical Equipment
• Hard Drives
• Glucose Meters
3 Description
The ADS7042 is a 12-bit, 1-MSPS, analog-to-digital converter (ADC). The device supports a wide analog input voltage range (1.65 V to 3.6 V) and includes a capacitor-based, successive-approximation register (SAR) ADC with an inherent sample-and-hold circuit. The SPI-compatible serial interface is controlled by the CS and SCLK signals. The input signal is sampled with the CS falling edge and SCLK is used for conversion and serial data output. The device supports a wide digital supply range (1.65 V to 3.6 V), enabling direct interface to a variety of host controllers. The ADS7042 complies with the JESD8- 7A standard for a normal DVDD range (1.65 V to 1.95 V).
The ADS7042 is available in 8-pin, miniature, leaded, and X2QFN packages and is specified for operation from –40°C to 125°C. Miniature form-factor and extremely low-power consumption make this device suitable for space-constrained, battery-powered applications.
Device Information(1)
| PART NAME | PACKAGE | BODY SIZE (NOM) |
| ADS7042 | X2QFN (8) | 1.50 mm × 1.50 mm |
| VSSOP (8) | 2.30 mm × 2.00 mm |
(1) For all available packages, see the orderable addendum at the end of the datasheet.
Typical Application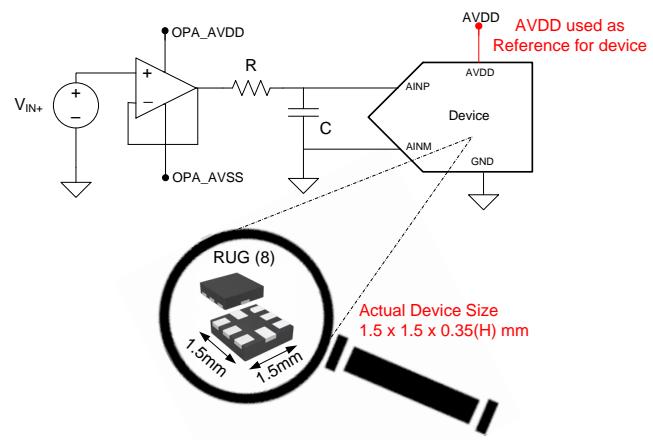
NOTE: The ADS7042 is smaller than a 0805 (2012 metric) SMD component.
Table of Contents
1 Features.... 1
2 Applications.... 1
3 Description.... 1
4 Revision History.... 2
5 Companion Products.... 4
6 Device Comparison.... 5
7 Pin Configuration and Functions.... 6
8 Specifications.... 7
8.1 Absolute Maximum Ratings.... 7
8.2 ESD Ratings.... 7
8.3 Recommended Operating Conditions.... 7
8.4 Thermal Information.... 7
8.5 Electrical Characteristics.... 8
8.6 Timing Characteristics.... 10
8.7 Typical Characteristics.... 11
9 Parameter Measurement Information.... 16
9.1 Digital Voltage Levels.... 16
10 Detailed Description.... 17
10.1 Overview.... 17
10.2 Functional Block Diagram.... 17
10.3 Feature Description.... 18
10.4 Device Functional Modes.... 22
11 Application and Implementation.... 25
11.1 Application Information.... 25
11.2 Typical Applications.... 25
12 Power-Supply Recommendations.... 33
12.1 AVDD and DVDD Supply Recommendations.... 33
12.2 Estimating Digital Power Consumption.... 33
12.3 Optimizing Power Consumed by the Device.... 33
13 Layout.... 34
13.1 Layout Guidelines.... 34
13.2 Layout Example.... 34
14 Device and Documentation Support.... 35
14.1 Documentation Support.... 35
14.2 Community Resources.... 35
14.3 Trademarks.... 35
14.4 Electrostatic Discharge Caution.... 35
14.5 Glossary.... 35
15 Mechanical, Packaging, and Orderable Information.... 35
4 Revision History
NOTE: Page numbers for previous revisions may differ from page numbers in the current version.
Changes from Revision B (February 2015) to Revision C Page
• Added Companion Products and Device Comparison sections .... 4
• Updated Figure 1 .... 10
• Changed Serial Interface section: changed last half of first paragraph, changed Figure 34 .... 21
• Changed Figure 37 .... 24
• Added Community Resources section .... 35
Changes from Revision A (August 2014) to Revision B Page
- Added TI Design.... 1
- Changed Wide Operating Range Features bullet: changed the value of AVDD from 1.8 V to 1.65 V .... 1
- Changed the wide analog input voltage range value to 1.65 V in first paragraph of Description section.... 1
- Changed ESD Ratings table to latest standards .... 7
- Changed AVDD parameter minimum specification in Recommended Operating Conditions table to 1.65 V .... 7
- Changed $E_{O}$ parameter uncalibrated test conditions in Electrical Characteristics table.... 8
- Changed Maximum throughput rate parameter test conditions in Electrical Characteristics table .... 8
- Changed AVDD parameter minimum specification in Electrical Characteristics table.... 9
- Changed conditions for Timing Characteristics table: changed range of AVDD and added $C_{LOAD}$ condition.... 10
- Changed $t_{D_CKDO}$ parameter in Timing Characteristics table .... 10
- Added $f_{SCLK}$ minimum specification to Timing Characteristics table .... 10
- Changed titles of Figure 26 to Figure 29.... 14
- Changed Reference sub-section in Feature Description section.... 18
- Changed range of second $f_{CLK-CAL}$ parameter description in Table 2 .... 23
- Changed range of second $f_{CLK-CAL}$ parameter description in Table 3 .... 24
www.ti.com
- Changed Reference Circuit section in Application Information .... 27
- Added last two sentences to AVDD and DVDD Supply Recommendations section .... 33
Page
• Made changes to product preview data sheet.... 1
5 Companion Products
| PART NUMBER | NAME |
| ADS1298 | 8-Channel, 24-Bit Analog-To-Digital Converter With Integrated ECG Front End |
| OPA835 | Ultra Low Power, Rail to Rail Out, Negative Rail In, VFB Amplifier |
| OPA314 | 3MHz, Low-Power, Low-Noise, RRI/O, 1.8V CMOS Operational Amplifier |
| ADS1294 | 4-Channel, 24-Bit Analog-To-Digital Converter With Integrated ECG Front End |
| ADS1298R | 8-Channel, 24-Bit Analog-To-Digital Converter w/Integrated Respiration Impedance and ECG Front End |
6 Device Comparison
| DEVICE | RESOLUTION (Bits) | ANALOG INPUT | THROUGHPUT (MSPS) |
| ADS7040 | 8 | Single-ended | 1 |
| ADS7041 | 10 | Single-ended | 1 |
| ADS7042 | 12 | Single-ended | 1 |
| ADS7043 | 12 | Pseudo-differential | 1 |
| ADS7044 | 12 | Fully differential | 1 |
7 Pin Configuration and Functions
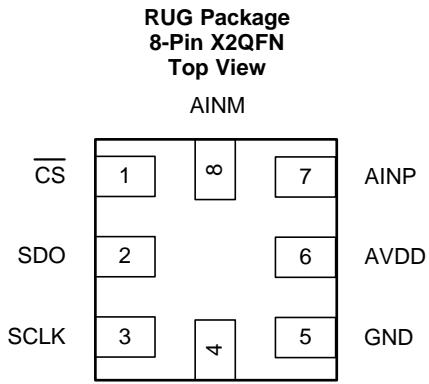
DVDD

Pin Functions
| PIN | I/O | DESCRIPTION | ||
| NAME | NO. | |||
| RUG | DCU | |||
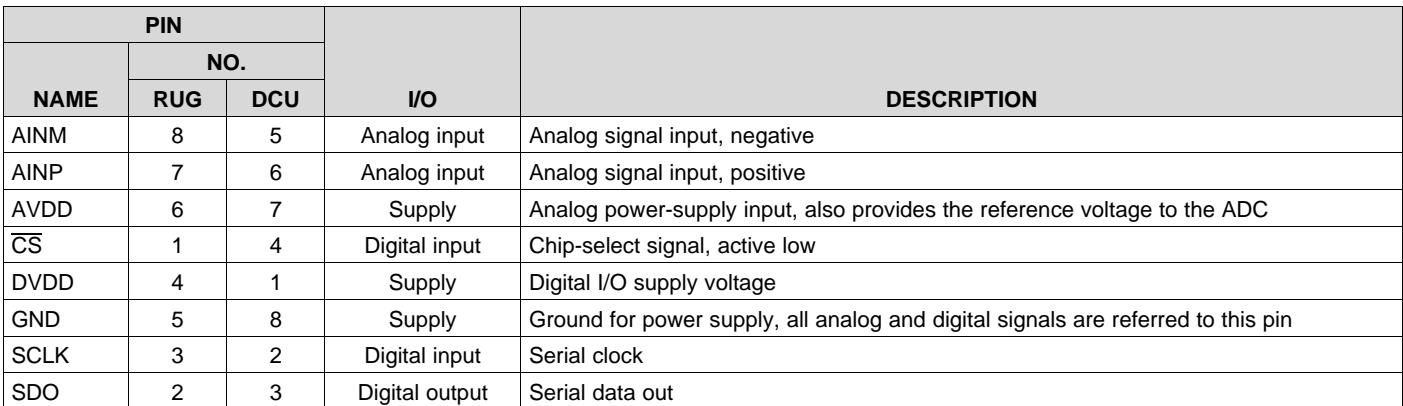
| AINM | 8 | 5 | Analog input | Analog signal input, negative |
| AINP | 7 | 6 | Analog input | Analog signal input, positive |
| AVDD | 6 | 7 | Supply | Analog power-supply input, also provides the reference voltage to the ADC |
| $\overline{CS}$ | 1 | 4 | Digital input | Chip-select signal, active low |
| DVDD | 4 | 1 | Supply | Digital I/O supply voltage |
| GND | 5 | 8 | Supply | Ground for power supply, all analog and digital signals are referred to this pin |
| SCLK | 3 | 2 | Digital input | Serial clock |
| SDO | 2 | 3 | Digital output | Serial data out |
8 Specifications
8.1 Absolute Maximum Ratings(1)
| MIN | MAX | UNIT | |
| AVDD to GND | -0.3 | 3.9 | V |
| DVDD to GND | -0.3 | 3.9 | V |
| AINP to GND | -0.3 | AVDD + 0.3 | V |
| AINM to GND | -0.3 | 0.3 | V |
| Digital input voltage to GND | -0.3 | DVDD + 0.3 | V |
| Storage temperature, $T_{stg}$ | -60 | 150 | °C |
(1) Stresses beyond those listed under Absolute Maximum Ratings may cause permanent damage to the device. These are stress ratings only, which do not imply functional operation of the device at these or any other conditions beyond those indicated under Recommended Operating Conditions. Exposure to absolute-maximum-rated conditions for extended periods may affect device reliability.
8.2 ESD Ratings
| VALUE | UNIT | ||
| $V_{(ESD)}$ Electrostatic discharge | Human body model (HBM), per ANSI/ESDA/JEDEC JS-001 $^{(1)}$ | ±2000 | V |
| Charged device model (CDM), per JEDEC specification JESD22-C101 $^{(2)}$ | ±1000 | ||
(1) JEDEC document JEP155 states that 500-V HBM allows safe manufacturing with a standard ESD control process.
(2) JEDEC document JEP157 states that 250-V CDM allows safe manufacturing with a standard ESD control process.
8.3 Recommended Operating Conditions
over operating free-air temperature range (unless otherwise noted)
| MIN | MAX | UNIT | ||
| AVDD | Analog supply voltage range | 1.65 | 3.6 | V |
| DVDD | Digital supply voltage range | 1.65 | 3.6 | V |
| $T_A$ | Operating free-air temperature | -40 | 125 | °C |
8.4 Thermal Information
| THERMAL METRIC(1) | ADS7042 | UNIT | ||
| RUG (X2QFN) | DCU (VSSOP) | |||
| 8 PINS | 8 PINS | |||
| $R_{\theta JA}$ | Junction-to-ambient thermal resistance | 177.5 | 235.8 | °C/W |
| $R_{\theta JC(top)}$ | Junction-to-case (top) thermal resistance | 51.5 | 79.8 | °C/W |
| $R_{\theta JB}$ | Junction-to-board thermal resistance | 76.7 | 117.6 | °C/W |
| $\psi_{JT}$ | Junction-to-top characterization parameter | 1.0 | 8.9 | °C/W |
| $\psi_{JB}$ | Junction-to-board characterization parameter | 76.7 | 116.5 | °C/W |
| $R_{\theta JC(bot)}$ | Junction-to-case (bottom) thermal resistance | N/A | N/A | °C/W |
(1) For more information about traditional and new thermal metrics, see the IC Package Thermal Metrics application report, SPRA953.
8.5 Electrical Characteristics
At $\mathsf { T } _ { \mathsf { A } } = - 4 0 ^ { \circ } \mathsf { C }$ to 125°C, AVDD = 3 V, DVDD = 1.65 V to 3.6 V, $\mathsf { f } _ { \mathsf { S A M P L E } } = 1 \mathsf { M S P S } ,$ and $\mathsf { V } _ { \mathsf { A I N M } } = 0 \setminus$ , unless otherwise noted.
| PARAMETER | TEST CONDITIONS | MIN | TYP | MAX | UNIT | ||
| ANALOG INPUT | |||||||
| Full-scale input voltage span(1) | 0 | AVDD | V | ||||
| Absolute input voltage range | AINP to GND | -0.1 | AVDD + 0.1 | V | |||
| AINM to GND | -0.1 | 0.1 | |||||
| $C_S$ | Sampling capacitance | 15 | pF | ||||
| SYSTEM PERFORMANCE | |||||||
| Resolution | 12 | Bits | |||||
| NMC | No missing codes | 12 | Bits | ||||
| INL | Integral nonlinearity | AVDD = 3 V | -1 | ±0.7 | 1 | LSB(2) | |
| AVDD = 1.8 V | -2 | ±1 | 2 | ||||
| DNL | Differential nonlinearity | AVDD = 3 V | -0.99 | ±0.5 | 1 | LSB | |
| AVDD = 1.8 V | -0.99 | ±0.7 | 2 | ||||
| $E_O$ | Offset error | Uncalibrated | AVDD = 1.65 V to 3.6 V | ±12 | LSB | ||
| Calibrated(3) | AVDD = 3 V | -3 | ±0.5 | 3 | |||
| AVDD = 1.8 V | -4 | ±1 | 4 | ||||
| $dV_{OS}/dT$ | Offset error drift with temperature | 5 | ppm/°C | ||||
| $E_G$ | Gain error | AVDD = 3 V | -0.1 | ±0.05 | 0.1 | %FS | |
| AVDD = 1.8 V | -0.2 | ±0.1 | 0.2 | ||||
| Gain error drift with temperature | 2 | ppm/°C | |||||
| SAMPLING DYNAMICS | |||||||
| $t_{ACQ}$ | Acquisition time | 200 | ns | ||||
| Maximum throughput rate | 16-MHz SCLK, AVDD = 1.65 V to 3.6 V | 1 | MHz | ||||
| DYNAMIC CHARACTERISTICS | |||||||
| SNR | Signal-to-noise ratio(4) | $f_{IN}$ =2 kHz, AVDD=3 V | 69 | 70 | dB | ||
| $f_{IN}$ =2 kHz, AVDD=1.8 V | 68 | ||||||
| THD | Total harmonic distortion(4)(5) | $f_{IN}$ =2 kHz, AVDD=3 V | -80 | dB | |||
| SINAD | Signal-to-noise and distortion(4) | $f_{IN}$ =2 kHz, AVDD=3 V | 68 | 69.5 | dB | ||
| $f_{IN}$ =2 kHz, AVDD=1.8 V | 67.5 | ||||||
| SFDR | Spurious-free dynamic range(4) | $f_{IN}$ =2 kHz, AVDD=3 V | 80 | dB | |||
| $BW_{(fp)}$ | Full-power bandwidth | At -3 dB, AVDD=3 V | 25 | MHz | |||
(1) Ideal input span; does not include gain or offset error.
(2) LSB means least significant bit.
(3) Refer to the Offset Calibration section for more details.
(4) All specifications expressed in decibels (dB) refer to the full-scale input (FSR) and are tested with an input signal 0.5 dB below full-scale, unless otherwise specified..
(5) Calculated on the first nine harmonics of the input frequency.
www.ti.com
Electrical Characteristics (continued)
| $At\ T_A = -40^\circ C to 125^\circ C, AVDD = 3 V, DVDD = 1.65 V to 3.6 V, f_{SAMPLE} = 1 MSPS, and V_{AINM} = 0 V, unless otherwise noted.$ | ||||||
| PARAMETER | TEST CONDITIONS | MIN | TYP | MAX | UNIT | |
| DIGITAL INPUT/OUTPUT (CMOS Logic Family) | ||||||
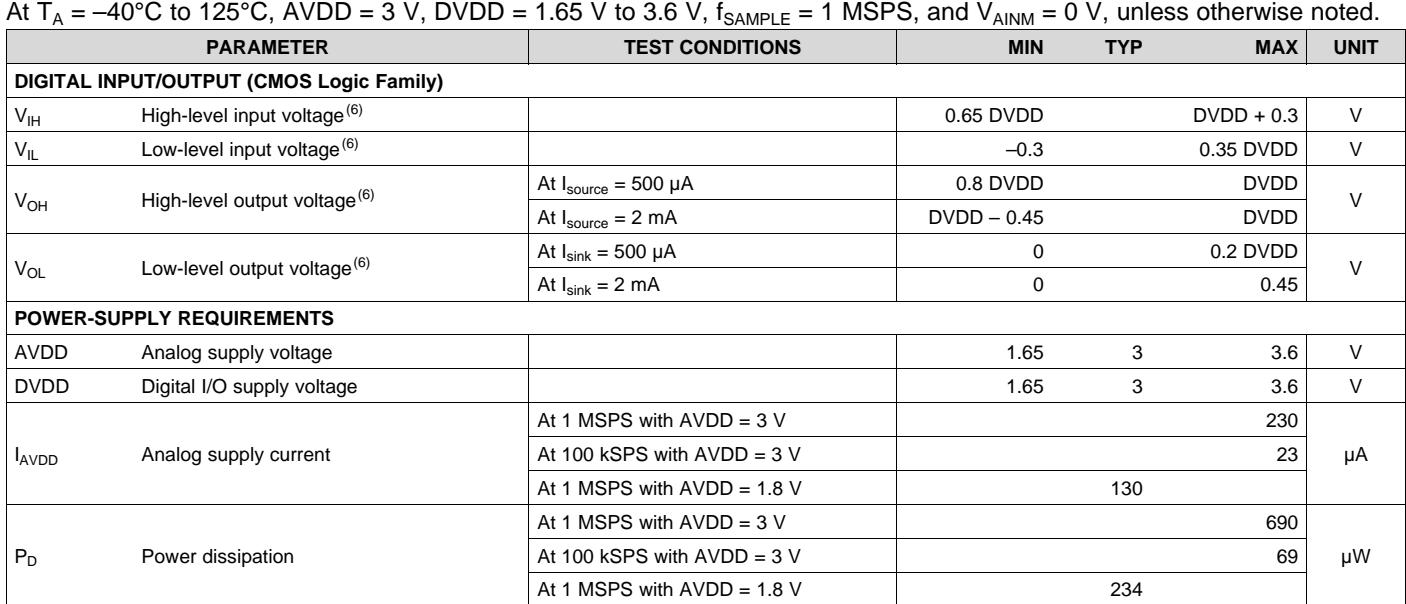
| $V_{IH}$ | High-level input $voltage^{(6)}$ | 0.65 DVDD | DVDD + 0.3 | V | ||
| $V_{IL}$ | Low-level input $voltage^{(6)}$ | -0.3 | 0.35 DVDD | V | ||
| $V_{OH}$ | High-level output $voltage^{(6)}$ | At $I_{source} = 500 \mu A$ | 0.8 DVDD | DVDD | V | |
| At $I_{source} = 2 mA$ | DVDD - 0.45 | DVDD | ||||
| $V_{OL}$ | Low-level output $voltage^{(6)}$ | At $I_{sink} = 500 \mu A$ | 0 | 0.2 DVDD | V | |
| At $I_{sink} = 2 mA$ | 0 | 0.45 | ||||
| POWER-SUPPLY REQUIREMENTS | ||||||
| AVDD | Analog supply voltage | 1.65 | 3 | 3.6 | V | |
| DVDD | Digital I/O supply voltage | 1.65 | 3 | 3.6 | V | |
| $I_{AVDD}$ | Analog supply current | At 1 MSPS with AVDD = 3 V | 230 | μA | ||
| At 100 kSPS with AVDD = 3 V | 23 | |||||
| At 1 MSPS with AVDD = 1.8 V | 130 | |||||
| $P_D$ | Power dissipation | At 1 MSPS with AVDD = 3 V | 690 | μW | ||
| At 100 kSPS with AVDD = 3 V | 69 | |||||
| At 1 MSPS with AVDD = 1.8 V | 234 | |||||
(6) Digital voltage levels comply with the JESD8-7A standard for DVDD from 1.65 V to 1.95 V. See the Digital Voltage Levels section for more details.
8.6 Timing Characteristics
All specifications are at $\mathsf { T } _ { \mathsf { A } } = - 4 0 ^ { \circ } \mathsf { C }$ to 125°C, AVDD = 1.65 V to 3.6 V, DVDD = 1.65 V to 3.6 V, and $\mathsf { C } _ { \mathsf { L O A D } }$ on ${ \mathsf { S D O } } = 2 0 { \mathsf { p F } }$ unless otherwise specified.
| MIN | TYP | MAX | UNIT | ||
| TIMING SPECIFICATIONS | |||||
| $f_{THROUGHPUT}$ | Throughput | 1 | MSPS | ||
| $t_{CYCLE}$ | Cycle time | 1 | μs | ||
| $t_{CONV}$ | Conversion time | $12.5 \times t_{SCLK} + t_{SU\_CSCK}$ | ns | ||
| $t_{DV\_CSDO}$ | Delay time: $\overline{CS}$ falling to data enable | 10 | ns | ||
| $t_{D\_CKDO}$ | Delay time: SCLK falling to (next) data valid on DOUT, AVDD = 1.8 V to 3.6 V | 30 | ns | ||
| Delay time: SCLK falling to (next) data valid on DOUT, AVDD = 1.65 V to 1.8 V | 50 | ns | |||
| $t_{DZ\_CSDO}$ | Delay time: $\overline{CS}$ rising to DOUT going to 3-state | 5 | ns | ||
| TIMING REQUIREMENTS | |||||
| $t_{ACQ}$ | Acquisition time | 200 | ns | ||
| $f_{SCLK}$ | SCLK frequency | 0.016 | 16 | MHz | |
| $t_{SCLK}$ | SCLK period | 62.5 | ns | ||
| $t_{PH\_CK}$ | SCLK high time | 0.45 | 0.55 | $t_{SCLK}$ | |
| $t_{PL\_CK}$ | SCLK low time | 0.45 | 0.55 | $t_{SCLK}$ | |
| $t_{PH\_CS}$ | $\overline{CS}$ high time | 60 | ns | ||
| $t_{SU\_CSCK}$ | Setup time: $\overline{CS}$ falling to SCLK falling | 15 | ns | ||
| $t_{D\_CKCS}$ | Delay time: last SCLK falling to $\overline{CS}$ rising | 10 | ns | ||

Figure 1. Timing Diagram
8.7 Typical Characteristics
At ${ \sf T } _ { \sf A } = 2 5 ^ { \circ } { \sf C } ,$ AVDD = 3 V, DVDD = 1.8 V, and $\mathsf { f } _ { \mathsf { S A M P L E } } = 1$ MSPS, unless otherwise noted.
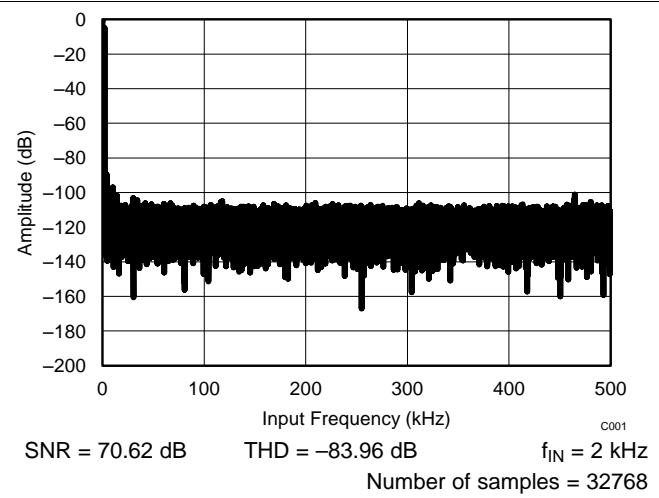
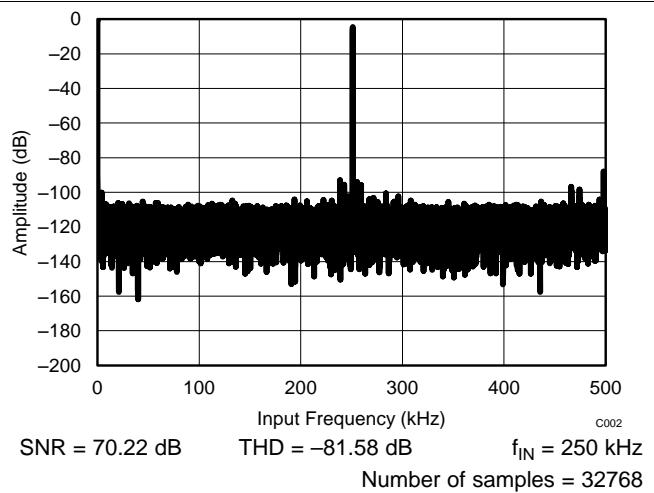
Figure 2. Typical FFT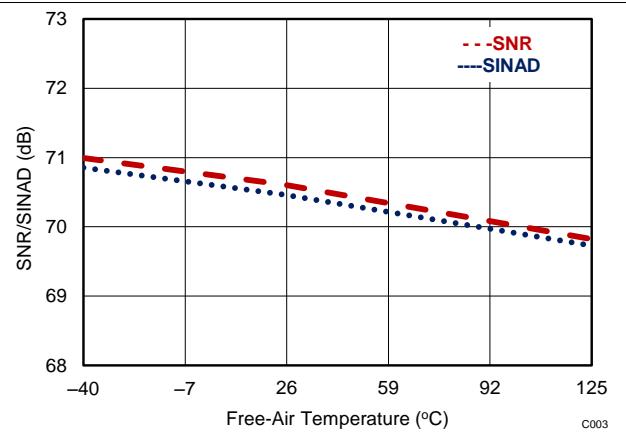
Figure 3. Typical FFT
Figure 4. SNR and SINAD vs Temperature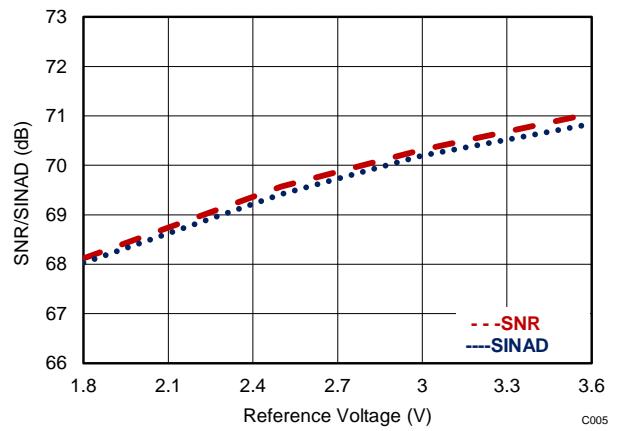
Figure 6. SNR and SINAD vs Reference Voltage (AVDD)
Figure 5. SNR and SINAD vs Input Frequency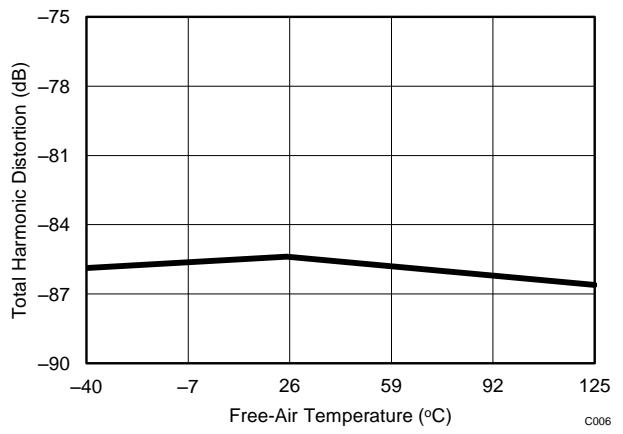
Figure 7. THD vs Free-Air Temperature
Typical Characteristics (continued)
At ${ \sf T } _ { \sf A } = 2 5 ^ { \circ } { \sf C }$ , AVDD = 3 V, DVDD = 1.8 V, and $\mathsf { f } _ { \mathsf { S A M P L E } } = 1$ MSPS, unless otherwise noted.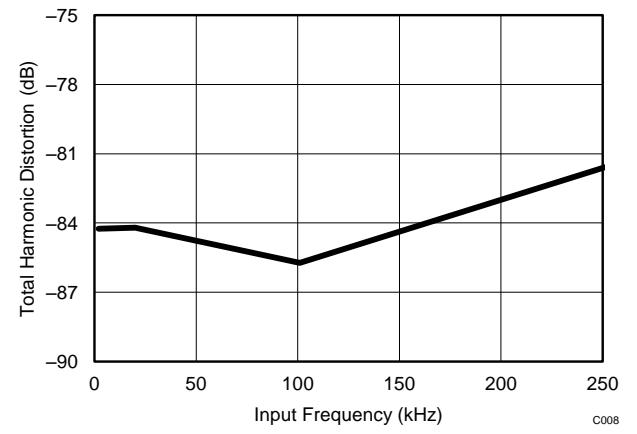

Figure 8. THD vs Input Frequency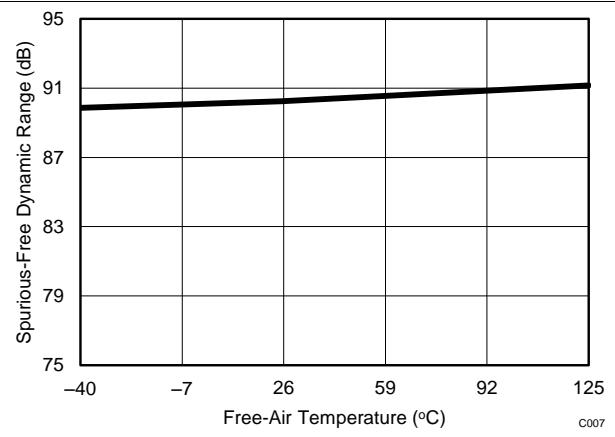
Figure 9. THD vs Reference Voltage (AVDD)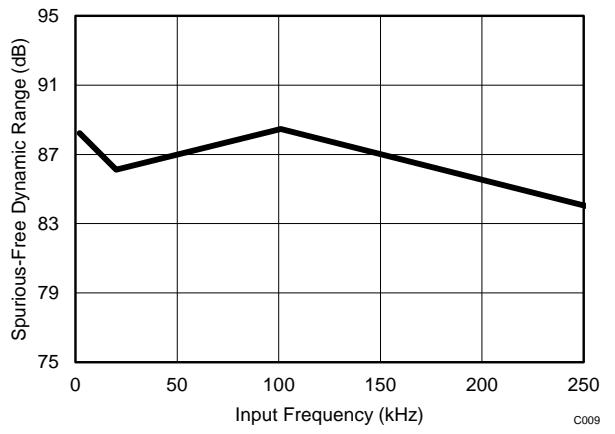
Figure 10. SFDR vs Free-Air Temperature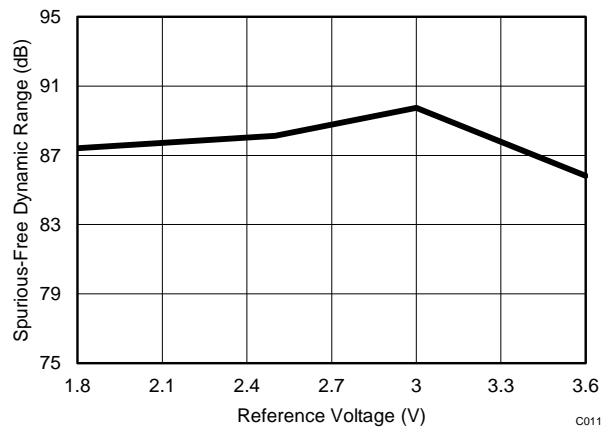
Figure 12. SFDR vs Reference Voltage (AVDD)
Figure 11. SFDR vs Input Frequency
Figure 13. DC Input Histogram
Typical Characteristics (continued)
At $\bar { \mathsf { T } } _ { \mathsf { A } } = 2 5 ^ { \circ } \mathsf { C }$ , AVDD = 3 V, DVDD = 1.8 V, and $\mathsf { f } _ { \mathsf { S A M P L E } } = 1$ MSPS, unless otherwise noted.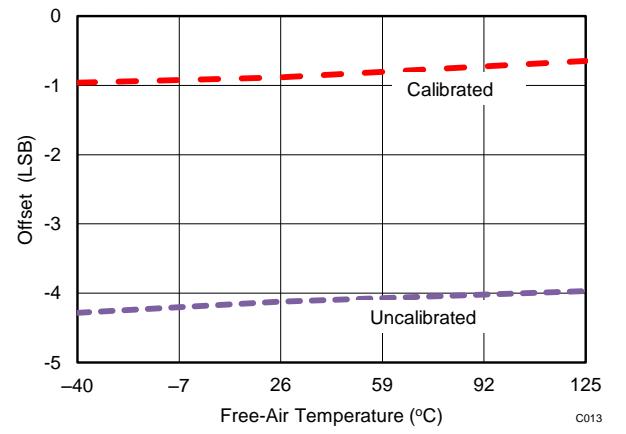

Figure 14. Offset vs Free-Air Temperature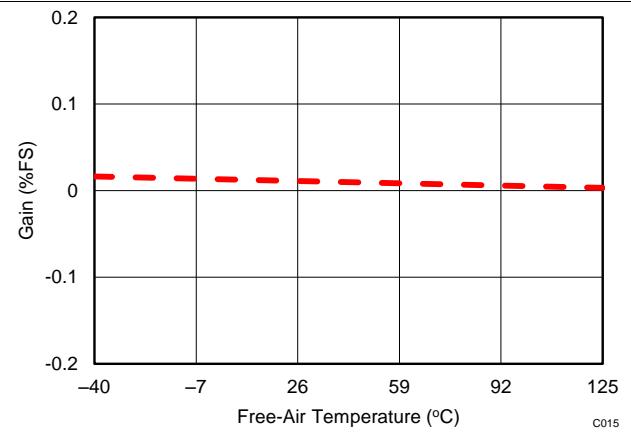
Figure 15. Offset vs Reference Voltage (AVDD)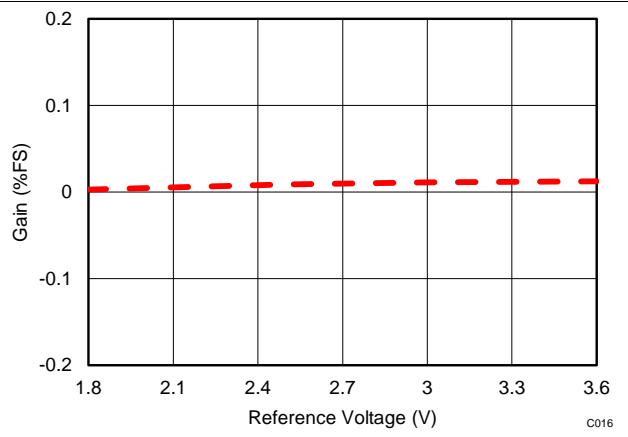
Figure 16. Gain Error vs Free-Air Temperature
Figure 18. Typical DNL
Figure 17. Gain Error vs Reference Voltage (AVDD)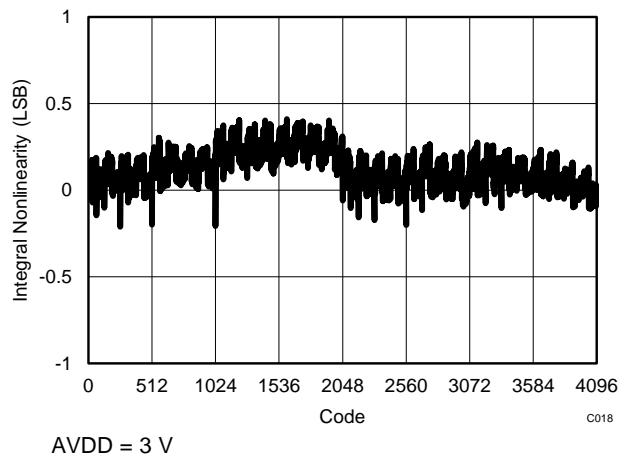
Figure 19. Typical INL
Typical Characteristics (continued)
At ${ \sf T } _ { \sf A } = 2 5 ^ { \circ } { \sf C }$ , AVDD = 3 V, DVDD = 1.8 V, and $\mathsf { f } _ { \mathsf { S A M P L E } } = 1$ MSPS, unless otherwise noted.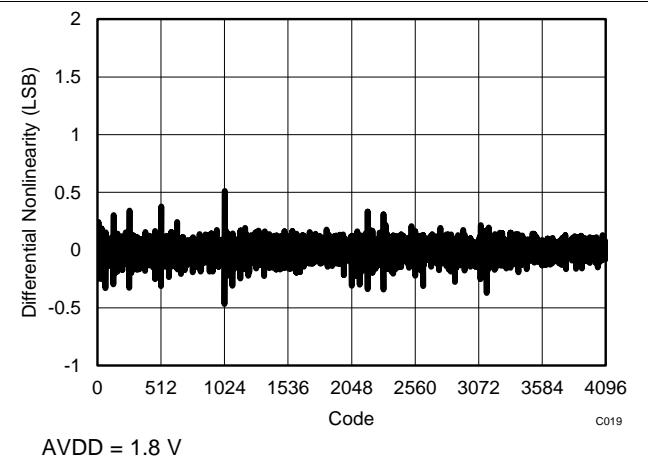
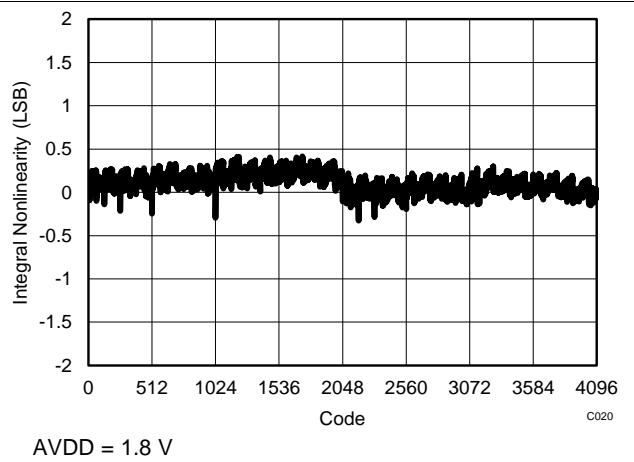
Figure 20. Typical DNL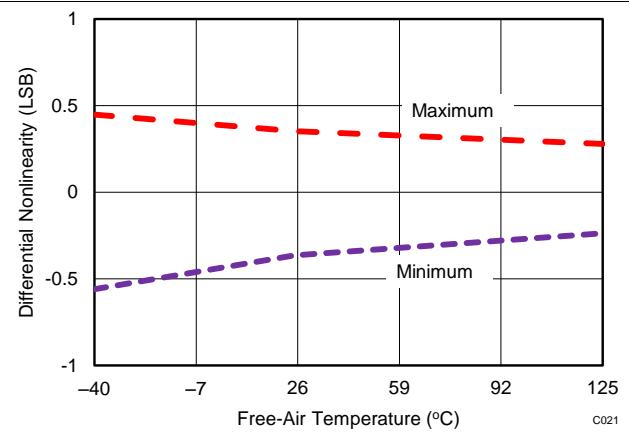
Figure 21. Typical INL
Figure 22. DNL vs Free-Air-Temperature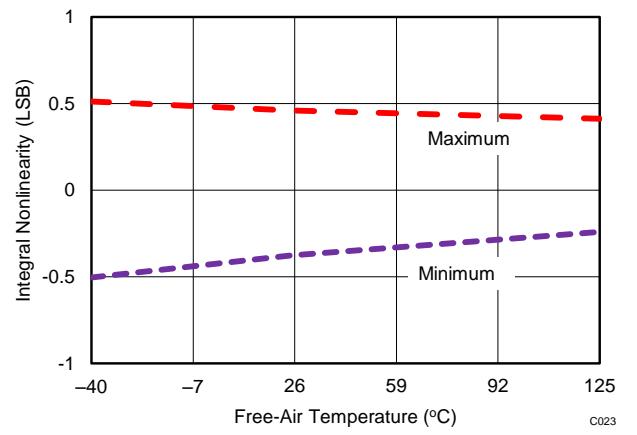
Figure 24. INL vs Free-Air-Temperature
Figure 23. DNL vs Reference Voltage (AVDD)
Figure 25. INL vs Reference Voltage (AVDD)
Typical Characteristics (continued)
At ${ \sf T } _ { \sf A } = 2 5 ^ { \circ } { \sf C }$ , AVDD = 3 V, DVDD = 1.8 V, and $\mathsf { f } _ { \mathsf { S A M P L E } } = 1$ MSPS, unless otherwise noted.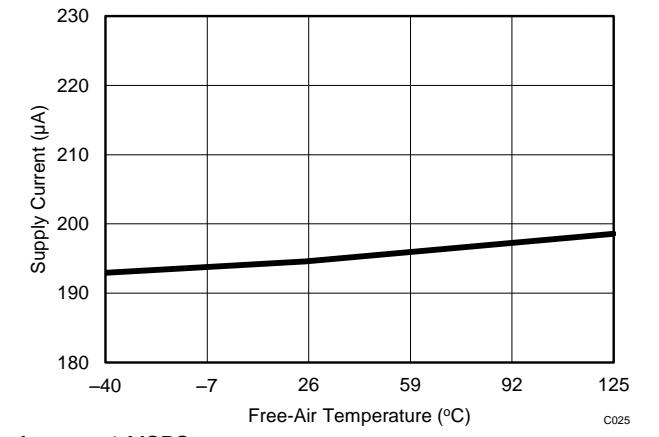
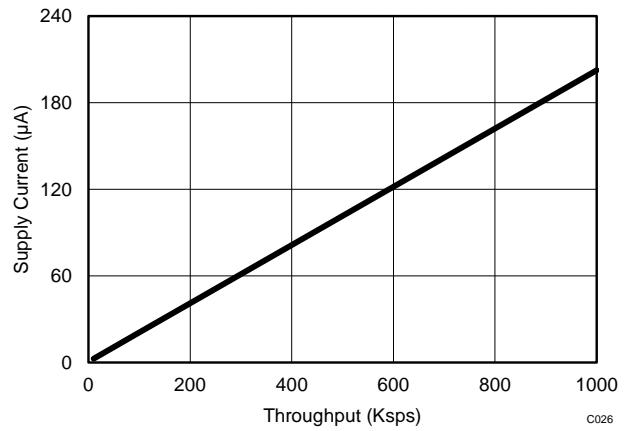
Figure 26. AVDD Supply Current vs Free-Air Temperature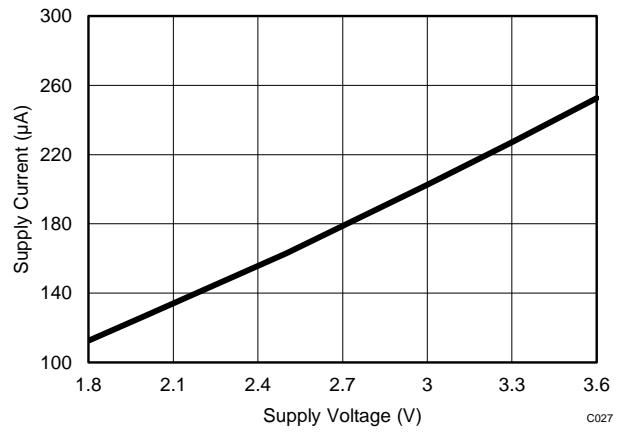
Figure 28. AVDD Supply Current vs AVDD Voltage
Figure 27. AVDD Supply Current vs Throughput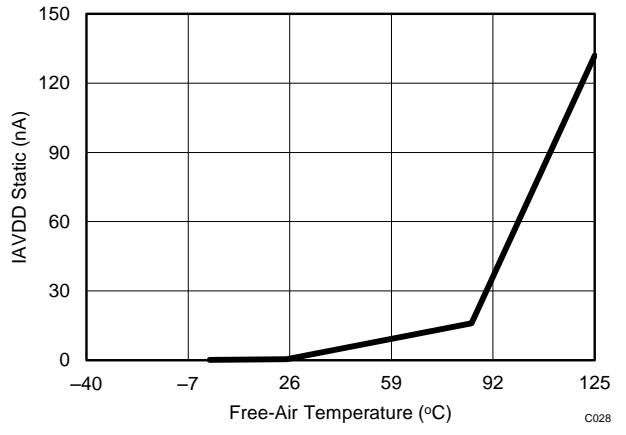
Figure 29. AVDD Static Current vs Free-Air Temperature
9 Parameter Measurement Information
9.1 Digital Voltage Levels
The device complies with the JESD8-7A standard for DVDD from 1.65 V to 1.95 V. Figure 30 shows voltage levels for the digital input and output pins.

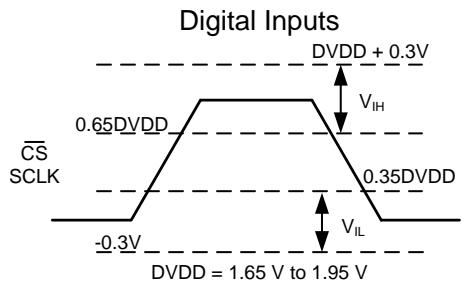
Figure 30. Digital Voltage Levels as per the JESD8-7A Standard
10 Detailed Description
10.1 Overview
The ADS7042 is an ultralow-power, ultra-small analog-to-digital converter (ADC) that supports a wide analog input range. The analog input range for the device is defined by the AVDD supply voltage. The device samples the input voltage across the AINP and AINM pins on the CS falling edge and starts the conversion. The clock provided on the SCLK pin is used for conversion and data transfer. During conversions, both the AINP and AINM pins are disconnected from the sampling circuit. After the conversion completes, the sampling capacitors are reconnected across the AINP and AINM pins and the ADS7042 enters acquisition phase.
The device has an internal offset calibration. The offset calibration can be initiated by the user either on power-up or during normal operation; see the Offset Calibration section for more details.
The device also provides a simple serial interface to the host controller and operates over a wide range of digital power supplies. The ADS7042 requires only a 16-MHz SCLK for supporting a throughput of 1 MSPS. The digital interface also complies with the JESD8-7A (normal range) standard. The Functional Block Diagram section provides a block diagram of the device.
10.2 Functional Block Diagram

10.3 Feature Description
10.3.1 Reference
The device uses the analog supply voltage (AVDD) as a reference, as shown in Figure 31. TI recommends decoupling the AVDD pin with a 1-µF, low equivalent series resistance (ESR) ceramic capacitor. The minimum capacitor value required for AVDD is 200 nF. The AVDD pin functions as a switched capacitor load to the source powering AVDD. The decoupling capacitor provides the instantaneous charge required by the internal circuit and helps in maintaining a stable dc voltage on the AVDD pin. TI recommends powering the AVDD pin with a low output impedance and low-noise regulator (such as the TPS79101).
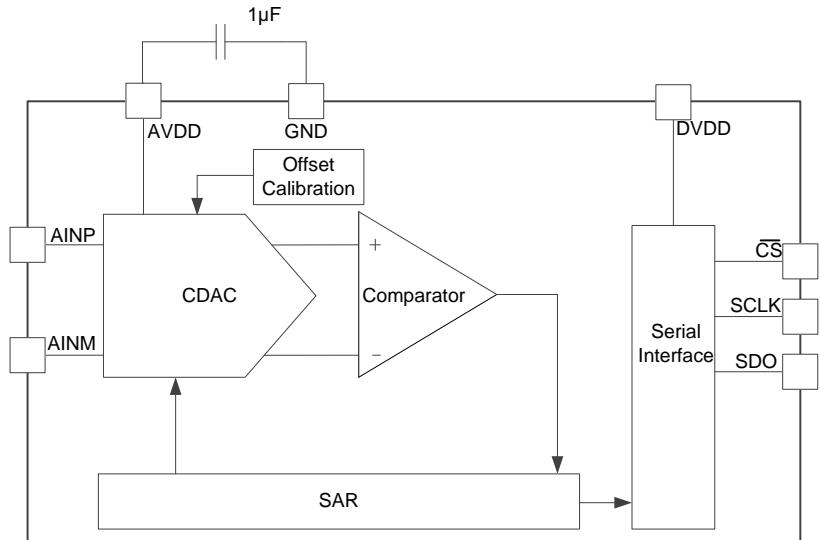
Figure 31. Reference for the Device
Feature Description (continued)
10.3.2 Analog Input
The device supports single-ended analog inputs. The ADC samples the difference between AINP and AINM and converts for this voltage. The device is capable of accepting a signal from –100 mV to 100 mV on the AINM input and is useful in systems where the sensor or signal-conditioning block is far from the ADC. In such a scenario, there can be a difference between the ground potential of the sensor or signal conditioner and the ADC ground. In such cases, use separate wires to connect the ground of the sensor or signal conditioner to the AINM pin. The AINP input is capable of accepting signals from 0 V to AVDD. Figure 32 represents the equivalent analog input circuits for the sampling stage. The device has a low-pass filter followed by the sampling switch and sampling capacitor. The sampling switch is represented by an R (typically 50 Ω) resistor in series with an ideal switch and $\complement _ { \mathsf { s } }$ (typically 15 pF) is the sampling capacitor. The ESD diodes are connected from both analog inputs to AVDD and ground.
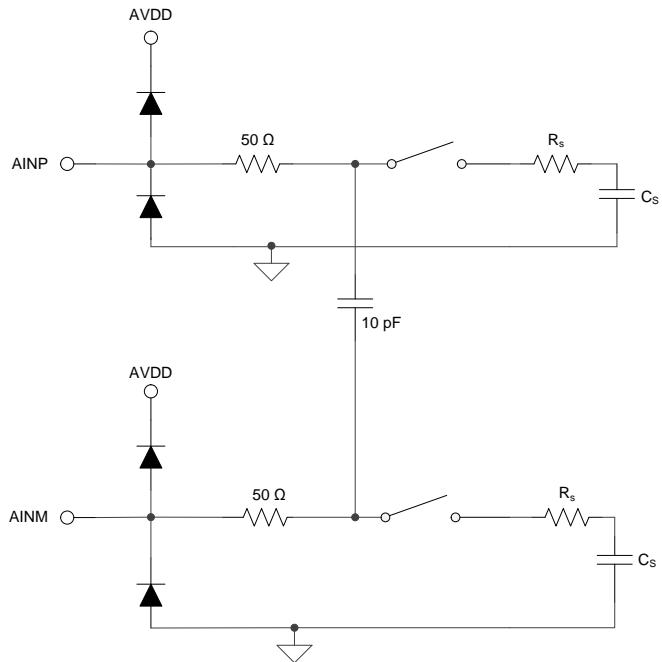
Figure 32. Equivalent Input Circuit for the Sampling Stage
The analog input full-scale range (FSR) is equal to the reference voltage of the ADC. The reference voltage for the device is equal to the analog supply voltage (AVDD). Thus, the device FSR can be determined by Equation 1:
$$
\mathrm{FSR} = \mathrm{V} _ {\mathrm{REF}} = \mathrm{AVDD}\tag{1}
$$
10.3.3 ADC Transfer Function
The device output is in straight binary format. The device resolution for a single-ended input can be computed by Equation 2:
$$
1 \mathrm{LSB} = V _ {\mathrm{REF}} / 2 ^ {N}
$$
where:
$$
V _ {R E F} = A V D D \text { and }
$$
$N = 1 2$
(2)
Feature Description (continued)
Figure 33 and Table 1 show the ideal transfer characteristics for the device.

Figure 33. Ideal Transfer Characteristics
Table 1. Transfer Characteristics
| INPUT VOLTAGE (AINP – AINM) | CODE | DESCRIPTION | IDEAL OUTPUT CODE |
| ≤1 LSB | NFSC | Negative full-scale code | 000 |
| 1 LSB to 2 LSBs | NFSC + 1 | — | 001 |
| $(V_{REF} / 2)$ to $(V_{REF} / 2) + 1$ LSB | MC | Mid code | 800 |
| $(V_{REF} / 2) + 1$ LSB to $(V_{REF} / 2) + 2$ LSBs | MC + 1 | — | 801 |
| ≥ $V_{REF} - 1$ LSB | PFSC | Positive full-scale code | FFF |
10.3.4 Serial Interface
The device supports a simple, SPI-compatible interface to the external host. The $\overline { { \mathsf { C S } } }$ signal defines one conversion and serial transfer frame. A frame starts with a CS falling edge and ends with a CS rising edge. The SDO pin outputs the ADC conversion results. Figure 34 shows a detailed timing diagram for the serial interface. A minimum delay of $\mathfrak { t } _ { \mathtt { S U } _ { \mathtt { - } } }$ _CSCK must elapse between the CS falling edge and the first SCLK falling edge. The device uses the clock provided on the SCLK pin for conversion and data transfer. The conversion result is available on the SDO pin with the first two bits set to 0, followed by 12 bits of the conversion result. The first zero is launched on the SDO pin on the CS falling edge. Subsequent bits (starting with another 0 followed by the conversion result) are launched on the SDO pin on subsequent SCLK falling edges. The SDO output remains low after 14 SCLKs. A CS rising edge ends the frame and brings the serial data bus to 3-state. For acquisition of the next sample, a minimum time of $\mathtt { t _ { A C Q } }$ must be provided after the conversion of the current sample is completed. For details on timing specifications, see the Timing Characteristics table.
The device initiates an offset calibration on the first CS falling edge after power-up and the SDO output remains low during the first serial transfer frame after power-up. For further details, refer to the Offset Calibration section.
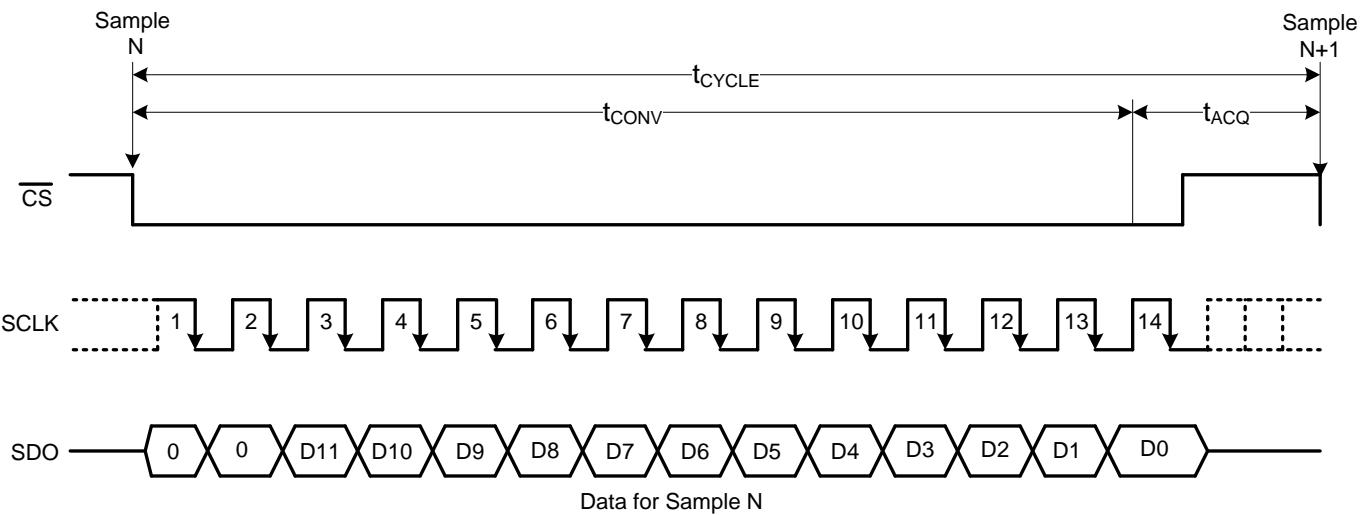
Figure 34. Serial Interface Timing Diagram
10.4 Device Functional Modes
10.4.1 Offset Calibration
The ADS7042 includes a feature to calibrate the device internal offset. During offset calibration, the analog input pins (AINP and AINM) are disconnected from the sampling stage. The device includes an internal offset calibration register (OCR) that stores the offset calibration result. The OCR is an internal register and cannot be accessed by the user through the serial interface. The OCR is reset to zero on power-up. Therefore, TI recommends calibrating the offset on power-up to bring the offset within the specified limits. If the operating temperature or analog supply voltage reflect a significant change, the offset can be recalibrated during normal operation. Figure 35 shows the offset calibration process.

(1) See the Timing Characteristics section for timing specifications.
(2) See the Offset Calibration During Normal Operation section for details.
(3) See the Offset Calibration on Power-Up section for details.
(4) The power recycle on the AVDD supply is required to reset the offset calibration and to bring the device to a power-up state.
Figure 35. Offset Calibration
Device Functional Modes (continued)
10.4.1.1 Offset Calibration on Power-Up
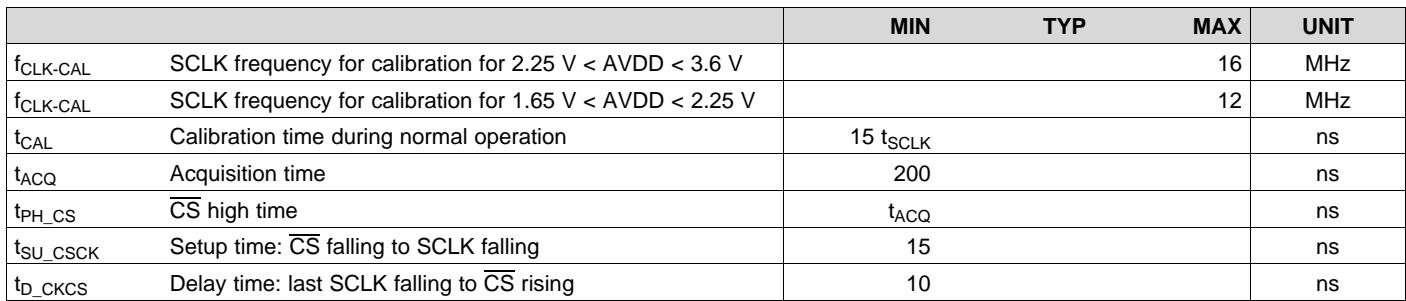
The device initiates offset calibration on the first CS falling edge after power-up and calibration completes if the CS pin remains low for at least 16 SCLK falling edges after the first CS falling edge. The SDO output remains low during calibration. The minimum acquisition time must be provided after calibration for acquiring the first sample. If the device is not provided with at least 16 SCLKs during the first serial transfer frame after power-up, the OCR is not updated. Table 2 provides the timing parameters for offset calibration on power-up.
For subsequent samples, the device adjusts the conversion results with the value stored in the OCR. The conversion result adjusted with the value stored in OCR is provided by the device on the SDO output. Figure 36 shows the timing diagram for offset calibration on power-up.
Table 2. Offset Calibration on Power-Up
| MIN | TYP | MAX | UNIT | ||
| $f_{CLK-CAL}$ | SCLK frequency for calibration for 2.25 V < AVDD < 3.6 V | 16 | MHz | ||
| $f_{CLK-CAL}$ | SCLK frequency for calibration for 1.65 V < AVDD < 2.25 V | 12 | MHz | ||
| $t_{POWERUP-CAL}$ | Calibration time at power-up | 15 $t_{SCLK}$ | ns | ||
| $t_{ACQ}$ | Acquisition time | 200 | ns | ||
| $t_{PH\_CS}$ | $\overline{CS}$ high time | $t_{ACQ}$ | ns | ||
| $t_{SU\_CSCK}$ | Setup time: $\overline{CS}$ falling to SCLK falling | 15 | ns | ||
| $t_{D\_CKCS}$ | Delay time: last SCLK falling to $\overline{CS}$ rising | 10 | ns | ||

Figure 36. Offset Calibration on Power-Up Timing Diagram
10.4.1.2 Offset Calibration During Normal Operation
Offset calibration can be done during normal device operation if at least 32 SCLK falling edges are provided in one serial transfer frame. During the first 14 SCLKs, the device converts the sample acquired on the CS falling edge and provides data on the SDO output. The device initiates the offset calibration on the 17th SCLK falling edge and calibration completes on the 32nd SCLK falling edge. The SDO output remains low after the 14th SCLK falling edge and SDO goes to 3-state after CS goes high. If the device is provided with less than 32 SCLKs during a serial transfer frame, the OCR is not updated. Table 3 provides the timing parameters for offset calibration during normal operation.
For subsequent samples, the device adjusts the conversion results with the value stored in the OCR. The conversion result adjusted with the value stored in the OCR is provided by the device on the SDO output. Figure 37 shows the timing diagram for offset calibration during normal operation.
Table 3. Offset Calibration During Normal Operation
| MIN | TYP | MAX | UNIT | ||
| $f_{CLK-CAL}$ | SCLK frequency for calibration for 2.25 V < AVDD < 3.6 V | 16 | MHz | ||
| $f_{CLK-CAL}$ | SCLK frequency for calibration for 1.65 V < AVDD < 2.25 V | 12 | MHz | ||
| $t_{CAL}$ | Calibration time during normal operation | 15 $t_{SCLK}$ | ns | ||
| $t_{ACQ}$ | Acquisition time | 200 | ns | ||
| $t_{PH\_CS}$ | $\overline{CS}$ high time | $t_{ACQ}$ | ns | ||
| $t_{SU\_CSCK}$ | Setup time: $\overline{CS}$ falling to SCLK falling | 15 | ns | ||
| $t_{D\_CKCS}$ | Delay time: last SCLK falling to $\overline{CS}$ rising | 10 | ns | ||

Figure 37. Offset Calibration During Normal Operation Timing Diagram
11 Application and Implementation
NOTE
Information in the following applications sections is not part of the TI component specification, and TI does not warrant its accuracy or completeness. TI’s customers are responsible for determining suitability of components for their purposes. Customers should validate and test their design implementation to confirm system functionality.
11.1 Application Information
The two primary circuits required to maximize the performance of a high-precision, successive approximation register (SAR), analog-to-digital converter (ADC) are the input driver and the reference driver circuits. This section details some general principles for designing the input driver circuit, reference driver circuit, and provides some application circuits designed for the ADS7042.
11.2 Typical Applications
11.2.1 Single-Supply DAQ with the ADS7042

Figure 38. DAQ Circuit: Single-Supply DAQ
11.2.1.1 Design Requirements
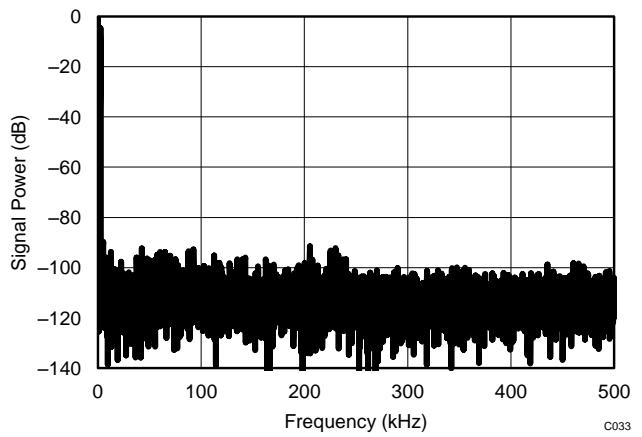
The goal of this application is to design a single-supply digital acquisition (DAQ) circuit based on the ADS7042 with SNR greater than 68 dB and THD less than –80 dB for input frequencies of 2.5 kHz at a throughput of 1 MSPS.
11.2.1.2 Detailed Design Procedure
The input driver circuit for a high-precision ADC mainly consists of two parts: a driving amplifier and an antialiasing filter. Careful design of the front-end circuit is critical to meet the linearity and noise performance of a high-precision ADC.
Typical Applications (continued)
11.2.1.2.1 Antialiasing Filter
Converting analog-to-digital signals requires sampling an input signal at a rate greater than or equal to the Nyquist rate. Any higher frequency content in the input signal beyond half the sampling frequency is digitized and folded back into the low-frequency spectrum. This process is called aliasing. Therefore, an external, antialiasing filter must be used to remove the harmonic content from the input signal before being sampled by the ADC. An antialiasing filter is designed as a low-pass RC filter, for which the 3-dB bandwidth is optimized for noise, response time, and throughput. For dc signals with fast transients (including multiplexed input signals), a highbandwidth filter is designed to allow accurately settling the signal at the ADC inputs during the small acquisition time window. Figure 39 provides the equation for determining the bandwidth of the antialiasing filter.
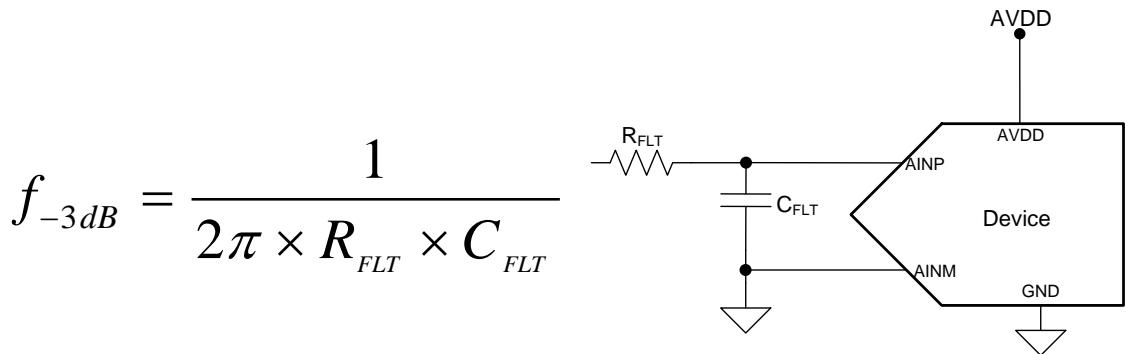
Figure 39. Antialiasing Filter
For ac signals, the filter bandwidth must be kept low to band limit the noise fed into the ADC input, thereby increasing the signal-to-noise ratio (SNR) of the system. Besides filtering the noise from the front-end drive circuitry, the RC filter also helps attenuate the sampling charge injection from the switched-capacitor input stage of the ADC. A filter capacitor, $C _ { \mathsf { F L T } } ,$ is connected across the ADC inputs. This capacitor helps reduce the sampling charge injection and provides a charge bucket to quickly charge the internal sample-and-hold capacitors during the acquisition process. As a rule of thumb, the value of this capacitor is at least 20 times the specified value of the ADC sampling capacitance. For this device, the input sampling capacitance is equal to 15 pF. Thus, the value of $\complement _ { \mathsf { F L T } }$ is greater than 300 pF. Select a COG- or NPO-type capacitor because these capacitor types have a high-Q, low-temperature coefficient, and stable electrical characteristics under varying voltages, frequency, and time.
Note that driving capacitive loads can degrade the phase margin of the input amplifiers, thus making the amplifier marginally unstable. To avoid amplifier stability issues, series isolation resistors $( \mathsf { R } _ { \mathsf { F L T } } )$ are used at the output of the amplifiers. A higher value of $\dot { \mathsf { R } } _ { \mathsf { F L T } }$ is helpful from the amplifier stability perspective, but adds distortion as a result of interactions with the nonlinear input impedance of the ADC. Distortion increases with source impedance, input signal frequency, and input signal amplitude. Therefore, the selection of $\mathsf { R } _ { \mathsf { F L T } }$ requires balancing the stability and distortion of the design.
The input amplifier bandwidth is typically much higher than the cutoff frequency of the antialiasing filter. Thus, TI strongly recommends performing a SPICE simulation to confirm that the amplifier has more than $4 0 ^ { \circ }$ phase margin with the selected filter. Simulation is critical because even with high-bandwidth amplifiers, some amplifiers can require more bandwidth than others to drive similar filters.
Typical Applications (continued)
11.2.1.2.2 Input Amplifier Selection
Selection criteria for the input amplifiers is highly dependent on the input signal type and the performance goals of the data acquisition system. Some key amplifier specifications to consider when selecting an appropriate amplifier to drive the inputs of the ADC are:
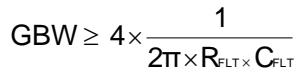
Small-signal bandwidth: Select the small-signal bandwidth of the input amplifiers to be high enough to settle the input signal in the acquisition time of the ADC. Higher bandwidth reduces the closed-loop output impedance of the amplifier, thus allowing the amplifier to more easily drive the low cutoff frequency RC filter at the ADC inputs. Higher bandwidth also minimizes the harmonic distortion at higher input frequencies. In order to maintain the overall stability of the input driver circuit, the select the amplifier bandwidth as described in Equation 3.
$$
\mathrm{GBW} \geq 4 \times \frac {1}{2 \pi \times R _ {\mathrm{FLT}} \times C _ {\mathrm{FLT}}}
$$
where:
$$
\bullet \quad G B W = u n i t y g a i n b a n d w i d t h\tag{3}
$$
Noise: Noise contribution of the front-end amplifiers must be low enough to prevent any degradation in SNR performance of the system. As a rule of thumb, to ensure that the noise performance of the data acquisition system is not limited by the front-end circuit, keep the total noise contribution from the front-end circuit below 20% of the input-referred noise of the ADC. Noise from the input driver circuit is band limited by designing a low cutoff frequency RC filter, as explained in Equation 4.
$$
N _ {G} \times \sqrt {\left(\frac {V _ {1 / f _ A M P _ P P}}{6 . 6}\right) ^ {2} + e ^ {2} n _ {- R M S} \times \frac {\pi}{2} \times f _ {- 3 d B}} \leq \frac {1}{5} \times \frac {V _ {R E F}}{2 \sqrt {2}} \times 1 0 ^ {- \left(\frac {S N R (d B)}{2 0}\right)}
$$
where:
$\mathsf { V } _ { 1 / \mathsf { f } _ A M P _ P P }$ is the peak-to-peak flicker noise in µVRMS,
$\mathsf { e } _ { \mathsf { n _ R M S } }$ is the amplifier broadband noise,
$\mathsf { f } _ { - 3 \mathsf { d B } }$ is the –3-dB bandwidth of the RC filter, and
$\mathsf { N } _ { \mathsf { G } }$ is the noise gain of the front-end circuit, which is equal to 1 in the buffer configuration.
(4)
Settling time: For dc signals with fast transients that are common in a multiplexed application, the input signal must settle to the desired accuracy at the inputs of the ADC during the acquisition time window. This condition is critical to maintain the overall linearity performance of the ADC. Typically, the amplifier data sheets specify the output settling performance only up to 0.1% to 0.001%, which may not be sufficient for the desired accuracy. Therefore, always verify the settling behavior of the input driver with TINA™-SPICE simulations before selecting the amplifier.
The OPA314 is selected for this application for its rail-to-rail input and output swing, low-noise (14 ${ \mathsf { n V } } / { \sqrt { { \mathsf { H z } } } } )$ , and low-power (150 µA) performance to support a single-supply data acquisition circuit.
11.2.1.2.3 Reference Circuit
The analog supply voltage of the device is also used as a voltage reference for conversion. TI recommends decoupling the AVDD pin with a 1-µF, low-ESR ceramic capacitor. The minimum capacitor value required for AVDD is 200 nF.
Typical Applications (continued)
11.2.1.3 Application Curve
Figure 40 shows the FFT plot for the ADS7042 with a 2.5-kHz input frequency used for the circuit in Figure 38.
Number of samples = 32768
Figure 40. Test Results for the ADS7042 and OPA314 for a 2.5-kHz Input
Typical Applications (continued)
11.2.2 DAQ Circuit with the ADS7042 for Maximum SINAD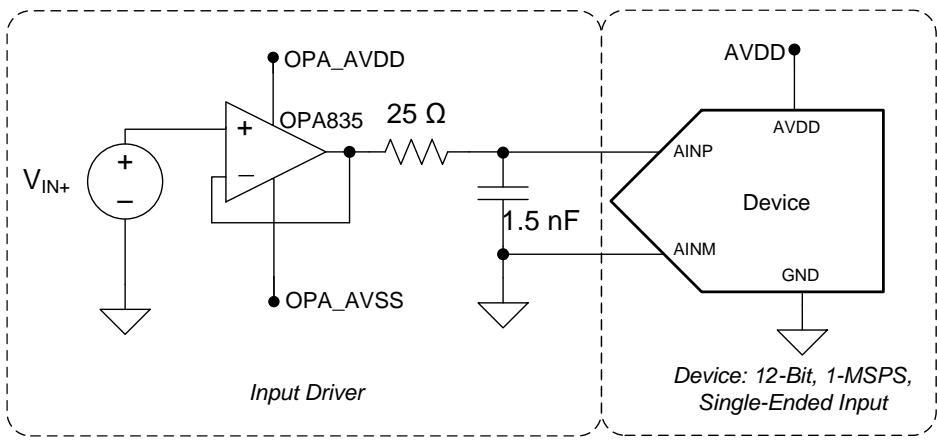
Figure 41. ADS7042 DAQ Circuit: Maximum SINAD for Input Frequencies up to 250 kHz
11.2.2.1 Design Requirements
The goal of this application is to design a data acquisition circuit based on the ADS7042 with SINAD greater than 69.5 dB for input frequencies up to 250 kHz.
11.2.2.2 Detailed Design Procedure
To achieve a SINAD of 69.5 dB, the operational amplifier must have high bandwidth in order to settle the input signal within the acquisition time of the ADC. The operational amplifier must have low noise to keep the total system noise below 20% of the input-referred noise of the ADC. For the application circuit shown in Figure 41, the OPA835 is selected for its high bandwidth (56 MHz) and low noise (9.3 nV/√Hz).
| <img src="./images/7c2650cc000d2fb209b3817414bf0de11c0f7c60db0803f203603ac1304931ad.jpg"/> | For a step-by-step design procedure, circuit schematics, bill of materials, PCB files, simulation results, and test results, refer to TI Precision Design TIPD168, Three 12-Bit Data Acquisition Reference Designs Optimized for Low Power and Ultra-Small Form Factor (TIDU390). |
11.2.2.3 Application Curves
Figure 42 shows the FFT plot for the ADS7042 with a 2-kHz input frequency used for the circuit in Figure 41. Figure 43 shows the FFT plot for the ADS7042 with a 250-kHz input frequency used for the circuit in Figure 41.

Figure 42. Test Results for the ADS7042 and OPA835 for a 2-kHz Input
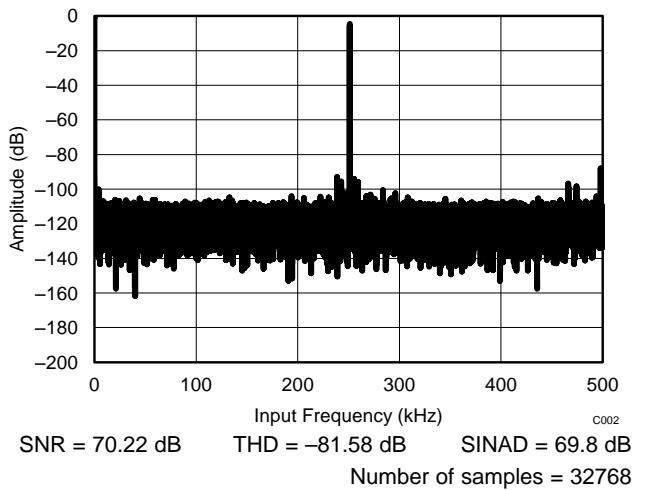
Figure 43. Test Results for the ADS7042 and OPA835 for a 250-kHz Input
11.2.3 12-Bit, 10-kSPS DAQ Circuit Optimized for DC Sensor Measurements

Figure 44. Interfacing the Device Directly with Sensors
In applications where the input is very slow moving and the overall system ENOB is not a critical parameter, a DAQ circuit can be designed without the input driver for the ADC . This type of a use case is of particular interest for applications in which the primary goal is to achieve the absolute lowest power possible. Typical applications that fall into this category are low-power sensor applications (such as temperature, pressure, humidity, gas, and chemical).
11.2.3.1 Design Requirements
For this design example, use the parameters listed in Table 4 as the input parameters.
Table 4. Design Parameters
| DESIGN PARAMETER | GOAL VALUE |
| Throughput | 10 kSPS |
| SNR at 100 Hz | 70 dB |
| THD at 100 Hz | 75dB |
| SINAD at 100 Hz | 69 dB |
| ENOB | 11 |
| Power | 10 μW |
11.2.3.2 Detailed Design Procedure
The ADS7042 can be directly interfaced with sensors at lower throughputs without the need of an amplifier buffer. The analog input source drive must be capable of driving the switched capacitor load of a SAR ADC and settling the analog input signal within the acquisition time of the SAR ADC. However, the output impedance of the sensor must be taken into account when interfacing a SAR ADC directly with sensors. Drive the analog input of the SAR ADC with a low impedance source. The input signal requires more acquisition time to settle to the desired accuracy because of the higher output impedance of the sensor. The simplified circuit for a sensor as a voltage source with output impedance $( \mathsf { R } _ { \mathsf { O U T } } )$ is shown in Figure 44.
The acquisition time of a SAR ADC (such as the ADS7042) can be increased by reducing throughput in the following ways:
Reducing the SCLK frequency to reduce the throughput, or
Keeping the SCLK fixed at the highest permissible value (that is, 16 MHz for the device) and increasing the CS high time.
Table 5 lists the acquisition time for the above two cases for a throughput of 100 kSPS. Clearly, case 2 provides more acquisition time for the input signal to settle.
Table 5. Acquisition Time with Different SCLK Frequencies
| CASE | SCLK | $t_{cycle}$ | CONVERSION TIME(= 12.5 × $t_{SCLK}$ + $t_{SU\_CSCK}$ ) | ACQUISITION TIME(= $t_{cycle}- t_{conv}$ ) |
| 1 | 1.6 MHz | 10 μs | 7.8125 μs | 2.1875 μs |
| 2 | 16 MHz | 10 μs | 0.78125 μs | 9.21875 μs |

For a step-by-step design procedure, circuit schematics, bill of materials, PCB files, simulation results, and test results, refer to TI Precision Design TIPD168, Three 12-Bit Data Acquisition Reference Designs Optimized for Low Power and Ultra-Small Form Factor (TIDU390).
11.2.3.3 Application Curve
When the output impedance of the sensor increases, the time required for the input signal to settle increases and the performance of the SAR ADC starts degrading if the input signal does not settle within the acquisition time of the ADC. The performance of the SAR ADC can be improved by reducing the throughput to provide enough time for the input signal to settle. Figure 45 provides the results for ENOB achieved from the ADS7042 for case 2 at different throughputs with different input impedances at the device input.
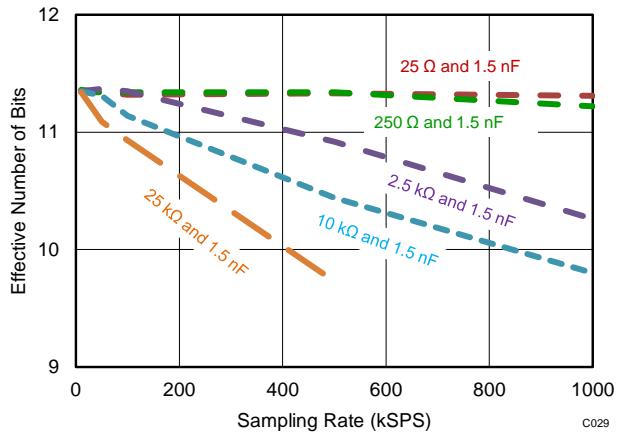
Figure 45. ENOB (Effective Number of Bits) Achieved from the ADS7042 at Different Throughputs Table 6 shows the results and performance summary for this 12-bit, 10-kSPS DAQ circuit application.
Table 6. Results and Performance Summary for 12-Bit, 10-kSPS DAQ Circuit for DC Sensor Measurements
| DESIGN PARAMETER | GOAL VALUE | ACHIEVED RESULT |
| Throughput | 10 kSPS | 10 kSPS |
| SNR at 100 Hz | 70 dB | 70.6 dB |
| THD at 100 Hz | 75dB | 83.5 dB |
| SINAD at 100 Hz | 69dB | 70.4 dB |
| ENOB | 11 | 11.4 |
| Power | 10 μW | 7 μW |
12 Power-Supply Recommendations
12.1 AVDD and DVDD Supply Recommendations
The ADS7042 has two separate power supplies: AVDD and DVDD. The device operates on AVDD; DVDD is used for the interface circuits. AVDD and DVDD can be independently set to any value within the permissible ranges. The AVDD supply also defines the full-scale input range of the device. Always set the AVDD supply to be greater than or equal to the maximum input signal to avoid saturation of codes. Decouple the AVDD and DVDD pins individually with 1-µF ceramic decoupling capacitors, as shown in Figure 46. The minimum capacitor value required for AVDD and DVDD is 200 nF and 20 nF, respectively. If both supplies are powered from the same source, a minimum capacitor value of 220 nF is required for decoupling.
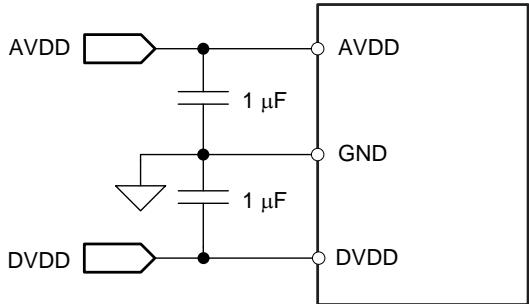
Figure 46. Power-Supply Decoupling
12.2 Estimating Digital Power Consumption
The current consumption from the DVDD supply depends on the DVDD voltage, load capacitance on the SDO line, and the output code. The load capacitance on the SDO line is charged by the current from the SDO pin on every rising edge of the data output and is discharged on every falling edge of the data output. The current consumed by the device from the DVDD supply can be calculated by Equation 5:
IDVDD = C × V × f
where:
• C = Load capacitance on the SDO line,
• V = DVDD supply voltage, and
• f = Number of transitions on the SDO output.
(5)
The number of transitions on the SDO output depends on the output code, and thus changes with the analog input. The maximum value of f occurs when data output on the SDO change on every SCLK. SDO changing on every SCLK results in an output code of AAAh or 555h. For an output code of AAAh or 555h at a 1-MSPS throughput, the frequency of transitions on the SDO output is 6MHz.
For the current consumption to remain at the lowest possible value, keep the DVDD supply at the lowest permissible value and keep the capacitance on the SDO line as low as possible.
12.3 Optimizing Power Consumed by the Device
• Keep the analog supply voltage (AVDD) as close as possible to the analog input voltage. Set AVDD to be greater than or equal to the analog input voltage of the device.
• Keep the digital supply voltage (DVDD) at the lowest permissible value.
• Reduce the load capacitance on the SDO output.
• Run the device at the optimum throughput. Power consumption reduces with throughput.
13 Layout
13.1 Layout Guidelines
Figure 47 shows a board layout example for the ADS7042. Use a ground plane underneath the device and partition the PCB into analog and digital sections. Avoid crossing digital lines with the analog signal path and keep the analog input signals and the reference input signals away from noise sources. In Figure 47, the analog input and reference signals are routed on the top and left side of the device and the digital connections are routed on the bottom and right side of the device.
The power sources to the device must be clean and well-bypassed. Use 1-μF ceramic bypass capacitors in close proximity to the analog (AVDD) and digital (DVDD) power-supply pins. Avoid placing vias between the AVDD and DVDD pins and the bypass capacitors. Connect all ground pins to the ground plane using short, low-impedance paths. The AVDD supply voltage for the ADS7042 also functions as a reference for the device. Place the decoupling capacitor $( \dot { C } _ { \mathsf { R E F } } )$ for AVDD close to the device AVDD and GND pins and connect $C _ { \mathsf { R E F } }$ to the device pins with thick copper tracks, as shown in Figure 47.
The fly-wheel RC filters are placed close to the device. Among ceramic surface-mount capacitors, COG (NPO) ceramic capacitors provide the best capacitance precision. The type of dielectric used in COG (NPO) ceramic capacitors provides the most stable electrical properties over voltage, frequency, and temperature changes.
13.2 Layout Example

Figure 47. Example Layout
14 Device and Documentation Support
14.1 Documentation Support
14.1.1 Related Documentation
For related documentation see the following:
• OPA314 Data Sheet, SBOS563
• OPA835 Data Sheet, SLOS713
• TPS79101 Data Sheet, SLVS325
• TIPD168 Reference Guide, TIDU390
14.2 Community Resources
The following links connect to TI community resources. Linked contents are provided "AS IS" by the respective contributors. They do not constitute TI specifications and do not necessarily reflect TI's views; see TI's Terms of Use.
TI E2E™ Online Community TI's Engineer-to-Engineer (E2E) Community. Created to foster collaboration among engineers. At e2e.ti.com, you can ask questions, share knowledge, explore ideas and help solve problems with fellow engineers.
Design Support TI's Design Support Quickly find helpful E2E forums along with design support tools and contact information for technical support.
14.3 Trademarks
E2E is a trademark of Texas Instruments.
TINA is a trademark of Texas Instruments, Inc.
SPI is a trademark of Motorola.
All other trademarks are the property of their respective owners.
14.4 Electrostatic Discharge Caution

This integrated circuit can be damaged by ESD. Texas Instruments recommends that all integrated circuits be handled with appropriate precautions. Failure to observe proper handling and installation procedures can cause damage.
ESD damage can range from subtle performance degradation to complete device failure. Precision integrated circuits may be more susceptible to damage because very small parametric changes could cause the device not to meet its published specifications.
14.5 Glossary
SLYZ022 — TI Glossary.
This glossary lists and explains terms, acronyms, and definitions.
15 Mechanical, Packaging, and Orderable Information
The following pages include mechanical packaging and orderable information. This information is the most current data available for the designated devices. This data is subject to change without notice and revision of this document. For browser-based versions of this data sheet, refer to the left-hand navigation.
RUG0008A
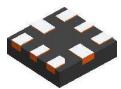
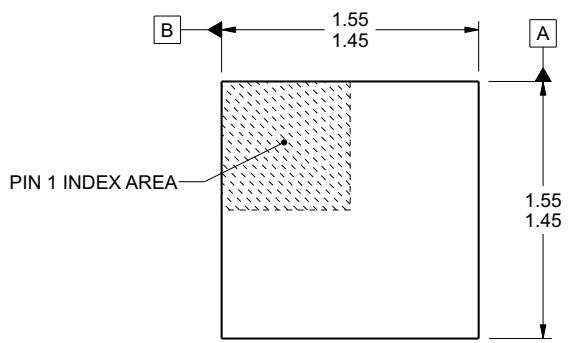
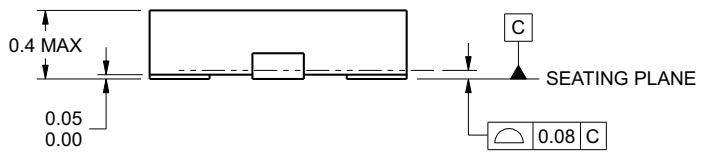
PACKAGE OUTLINE
X2QFN - 0.4 mm max height
PLASTIC QUAD FLATPACK - NO LEAD
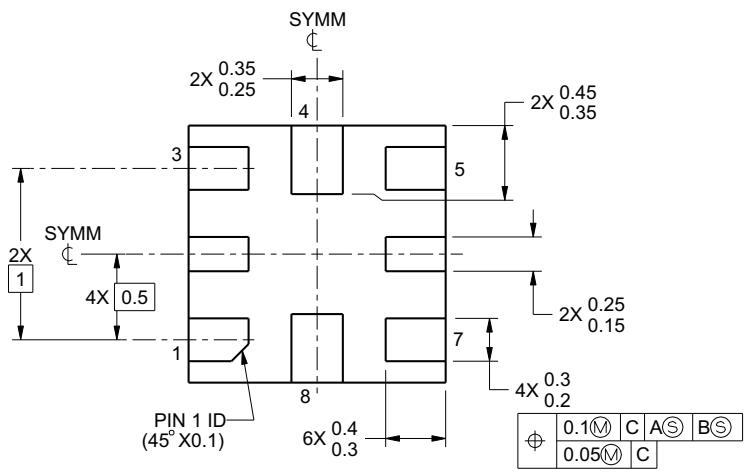
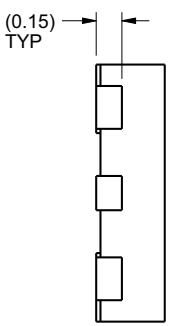
4222060/A 05/14/2015
NOTES:
All linear dimensions are in millimeters. Any dimensions in parenthesis are for reference only. Dimensioning and tolerancing per ASME Y14.5M.
This drawing is subject to change without notice.
RUG0008A
X2QFN - 0.4 mm max height
PLASTIC QUAD FLATPACK - NO LEAD

4222060/A 05/14/2015
- For more information, see Texas Instruments literature number SLUA271 (www.ti.com/lit/slua271).
EXAMPLE STENCIL DESIGN
RUG0008A
X2QFN - 0.4 mm max height
PLASTIC QUAD FLATPACK - NO LEAD
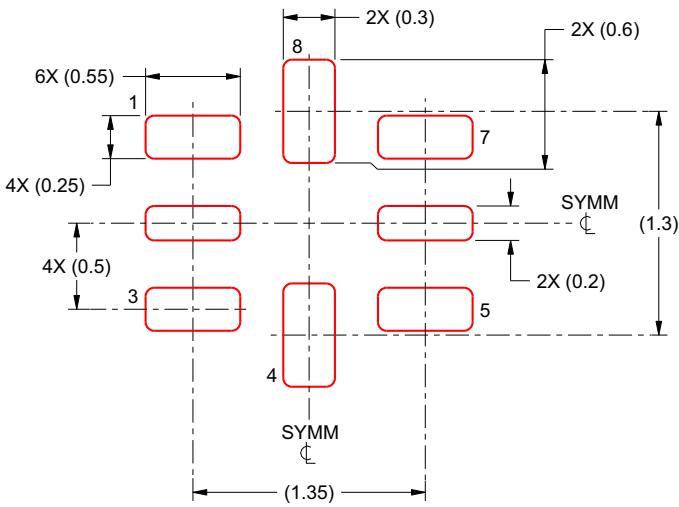
SOLDER PASTE EXAMPLE BASED ON 0.1 mm THICKNESS SCALE:25X
NOTES: (continued)
4222060/A 05/14/2015
- Laser cutting apertures with trapezoidal walls and rounded corners may offer better paste release. IPC-7525 may have alternate design recommendations.
PACKAGING INFORMATION
| Orderable part number | Status(1) | Material type(2) | Package | Pins | Package qty | Carrier | RoHS(3) | Lead finish/ Ball material(4) | MSL rating/ Peak reflow(5) | Op temp (°C) | Part marking(6) |
| ADS7042IDCUR | Active | Production | VSSOP (DCU) | 8 | 3000 | LARGE T&R | Yes | NIPDAU | Level-1-260C-UNLIM | -40 to 125 | 7042 |
| ADS7042IDCUR.A | Active | Production | VSSOP (DCU) | 8 | 3000 | LARGE T&R | Yes | NIPDAU | Level-1-260C-UNLIM | -40 to 125 | 7042 |
| ADS7042IDCURG4 | Active | Production | VSSOP (DCU) | 8 | 3000 | LARGE T&R | Yes | NIPDAU | Level-1-260C-UNLIM | -40 to 125 | 7042 |
| ADS7042IDCURG4.A | Active | Production | VSSOP (DCU) | 8 | 3000 | LARGE T&R | Yes | NIPDAU | Level-1-260C-UNLIM | -40 to 125 | 7042 |
| ADS7042IDCUT | Active | Production | VSSOP (DCU) | 8 | 250 | SMALL T&R | Yes | NIPDAU | Level-1-260C-UNLIM | -40 to 125 | 7042 |
| ADS7042IDCUT.A | Active | Production | VSSOP (DCU) | 8 | 250 | SMALL T&R | Yes | NIPDAU | Level-1-260C-UNLIM | -40 to 125 | 7042 |
| ADS7042IRUGR | Active | Production | X2QFN (RUG) | 8 | 3000 | LARGE T&R | Yes | NIPDAUAG | Level-1-260C-UNLIM | -40 to 125 | FV |
| ADS7042IRUGR.A | Active | Production | X2QFN (RUG) | 8 | 3000 | LARGE T&R | Yes | NIPDAUAG | Level-1-260C-UNLIM | -40 to 125 | FV |
(1) Status: For more details on status, see our product life cycle.
(2) Material type: When designated, preproduction parts are prototypes/experimental devices, and are not yet approved or released for full production. Testing and final process, including without limitation quality assurance, reliability performance testing, and/or process qualification, may not yet be complete, and this item is subject to further changes or possible discontinuation. If available for ordering, purchases will be subject to an additional waiver at checkout, and are intended for early internal evaluation purposes only. These items are sold without warranties of any kind.
(3) RoHS values: Yes, No, RoHS Exempt. See the TI RoHS Statement for additional information and value definition.
(4) Lead finish/Ball material: Parts may have multiple material finish options. Finish options are separated by a vertical ruled line. Lead finish/Ball material values may wrap to two lines if the finish value exceeds the maximum column width.
(5) MSL rating/Peak reflow: The moisture sensitivity level ratings and peak solder (reflow) temperatures. In the event that a part has multiple moisture sensitivity ratings, only the lowest level per JEDEC standards is shown. Refer to the shipping label for the actual reflow temperature that will be used to mount the part to the printed circuit board.
(6) Part marking: There may be an additional marking, which relates to the logo, the lot trace code information, or the environmental category of the part.
Multiple part markings will be inside parentheses. Only one part marking contained in parentheses and separated by a "~" will appear on a part. If a line is indented then it is a continuation of the previous line and the two combined represent the entire part marking for that device.
Important Information and Disclaimer:The information provided on this page represents TI's knowledge and belief as of the date that it is provided. TI bases its knowledge and belief on information provided by third parties, an makes no representation or warranty as to the accuracy of such information. Efforts are underway to better integrate information from third parties. TI has taken and continues to take reasonable steps to provide representativ and accurate information but may not have conducted destructive testing or chemical analysis on incoming materials and chemicals. TI and TI suppliers consider certain information to be proprietary, and thus CAS number
In no event shall TI's liability arising out of such information exceed the total purchase price of the TI part(s) at issue in this document sold by TI to Customer on an annual basis.
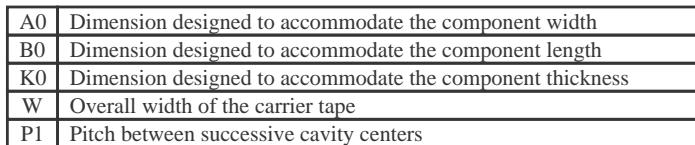
TAPE AND REEL INFORMATION

| A0 | Dimension designed to accommodate the component width |
| B0 | Dimension designed to accommodate the component length |
| K0 | Dimension designed to accommodate the component thickness |
| W | Overall width of the carrier tape |
| P1 | Pitch between successive cavity centers |
Reel Width (W1)
QUADRANT ASSIGNMENTS FOR PIN 1 ORIENTATION IN TAPE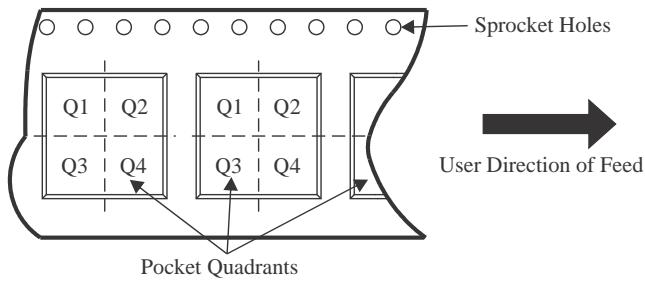
*All dimensions are nomina
| Device | Package Type | Package Drawing | Pins | SPQ | Reel Diameter (mm) | Reel Width W1 (mm) | A0 (mm) | B0 (mm) | K0 (mm) | P1 (mm) | W (mm) | Pin1 Quadrant |
| ADS7042IDCUR | VSSOP | DCU | 8 | 3000 | 180.0 | 8.4 | 2.25 | 3.35 | 1.05 | 4.0 | 8.0 | Q3 |
| ADS7042IDCURG4 | VSSOP | DCU | 8 | 3000 | 180.0 | 8.4 | 2.25 | 3.35 | 1.05 | 4.0 | 8.0 | Q3 |
| ADS7042IDCUT | VSSOP | DCU | 8 | 250 | 180.0 | 8.4 | 2.25 | 3.35 | 1.05 | 4.0 | 8.0 | Q3 |
| ADS7042IRUGR | X2QFN | RUG | 8 | 3000 | 180.0 | 8.4 | 1.6 | 1.6 | 0.66 | 4.0 | 8.0 | Q2 |

*All dimensions are nominal
| Device | Package Type | Package Drawing | Pins | SPQ | Length (mm) | Width (mm) | Height (mm) |
| ADS7042IDCUR | VSSOP | DCU | 8 | 3000 | 202.0 | 201.0 | 28.0 |
| ADS7042IDCURG4 | VSSOP | DCU | 8 | 3000 | 202.0 | 201.0 | 28.0 |
| ADS7042IDCUT | VSSOP | DCU | 8 | 250 | 202.0 | 201.0 | 28.0 |
| ADS7042IRUGR | X2QFN | RUG | 8 | 3000 | 202.0 | 201.0 | 28.0 |
SMALL OUTLINE PACKAGE
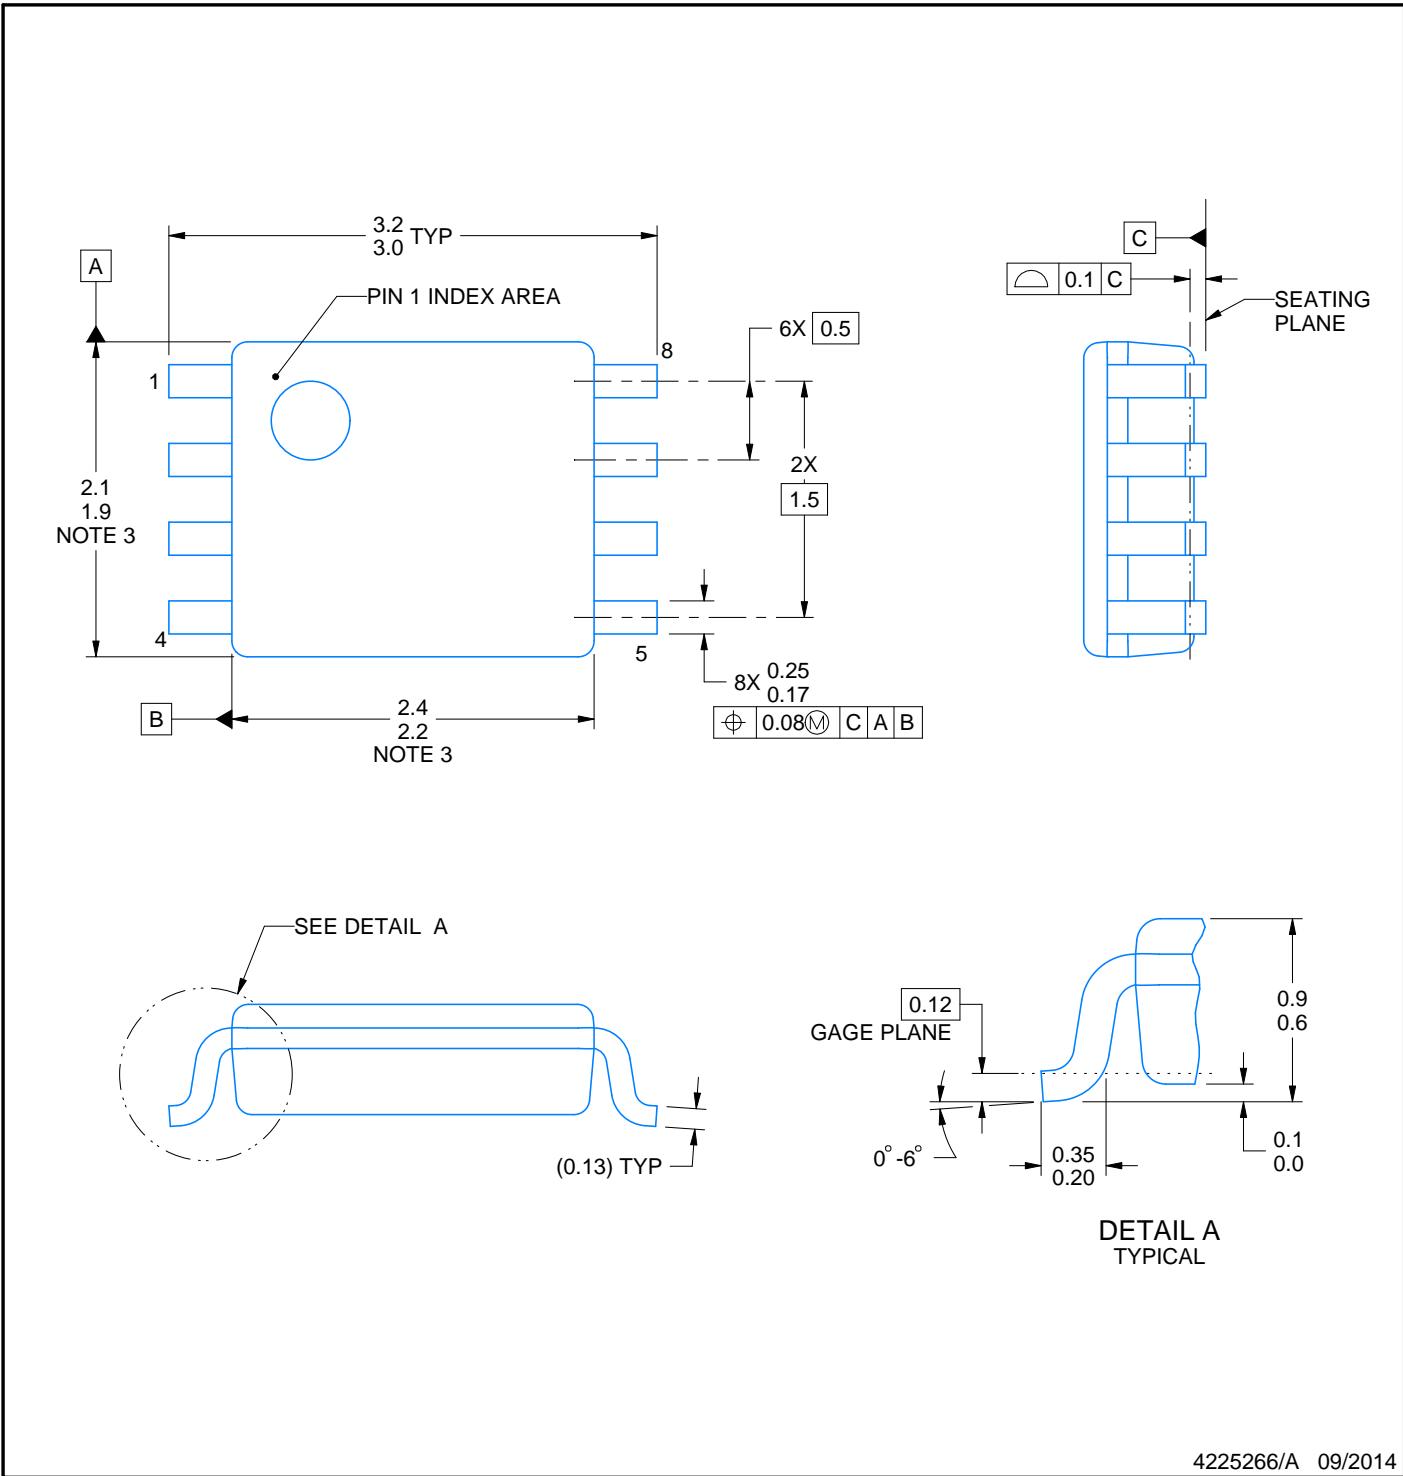
4225266/A 09/2014
NOTES:
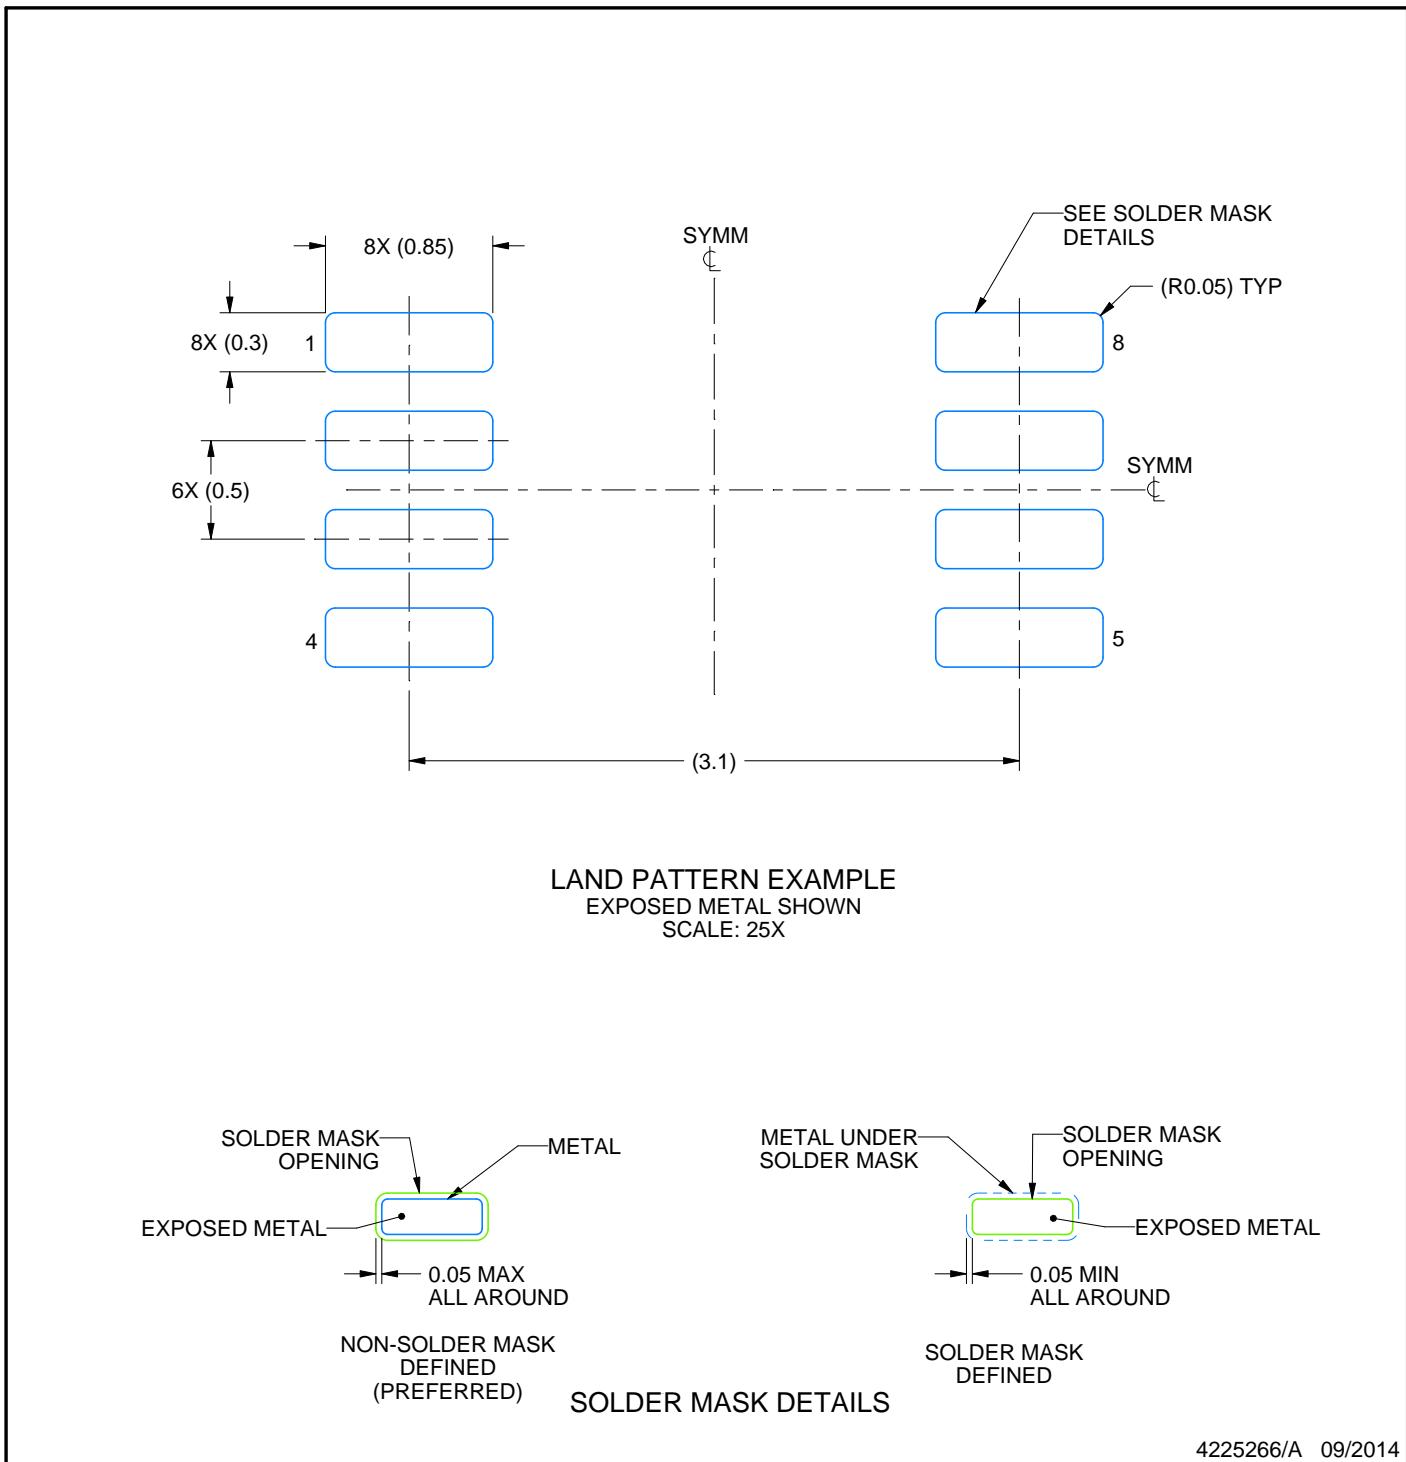
NOTES: (continued)
Publication IPC-7351 may have alternate designs.
Solder mask tolerances between and around signal pads can vary based on board fabrication site.

(R0.05) TYP
SOLDER PASTE EXAMPLE BASED ON 0.125 mm THICK STENCIL SCALE: 25X
4225266/A 09/2014
NOTES: (continued)
Laser cutting apertures with trapezoidal walls and rounded corners may offer better paste release. IPC-7525 may have alternate design recommendations.
Board assembly site may have different recommendations for stencil design.
Figures and diagrams from the PDF
Preview the extracted datasheet assets and open any image in a separate tab for closer inspection.












Use this datasheet from any agent
Send the page, markdown, chunks, or search endpoint to ChatGPT, Claude, embedr-app, or your own tooling.