
ACS724LLCTR-20AB-T Hall Current Sensor
Allegro ACS724LLCTR-20AB-T automotive-grade galvanically isolated Hall-effect current sensor IC for bidirectional +/-20 A AC/DC measurement, 5 V supply, 100 mV/A ratiometric analog output, SOIC-8 package.
Automotive-Grade, Galvanically Isolated Current Sensor IC with Common-Mode Field Rejection in a Small-Footprint SOIC8 Package
FEATURES AND BENEFITS
• AEC-Q100 qualified
• Differential Hall sensing rejects common-mode fields
• 1.2 mΩ primary conductor resistance for low power loss and high inrush current withstand capability
• Integrated shield virtually eliminates capacitive coupling from current conductor to die, greatly suppressing output noise due to high dV/dt transients
• Industry-leading noise performance with greatly improved bandwidth through proprietary amplifier and filter design techniques
• High-bandwidth 120 kHz analog output for faster response times in control applications
• Filter pin allows user to filter the output for improved resolution at lower bandwidth
• Patented integrated digital temperature-compensation circuitry allows for near-closed-loop accuracy over temperature, in an open-loop sensor
• Small-footprint, low-profile SOIC8 package suitable for space-constrained applications
• Filter pin simplifies bandwidth-limiting for better resolution at lower frequencies
Continued on the next page…

TÜV America Certificate Number: U8V 18 02 54214 041 CB 14 11 54214 031

CB Certificate Number: US-32848-UL
PACKAGE: 8-Pin SOIC (suffix LC)
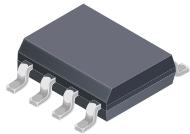
Not to scale
DESCRIPTION
The Allegro™ ACS724 current sensor integrated circuit (IC) is an economical and precise solution for AC or DC current sensing in industrial, automotive, commercial, and communications systems. The small package is ideal for space-constrained applications, and the reduced board area saves on costs. Typical applications include motor control, load detection and management, switched-mode power supplies, and overcurrent fault protection.
The device consists of a precise, low-offset, linear Hall sensor circuit with a copper conduction path located near the surface of the die. Applied current flowing through this copper conduction path generates a magnetic field that is sensed by the integrated Hall IC and is converted into a proportional voltage. The current is sensed differentially to reject common-mode fields, which improves accuracy in magnetically noisy environments. The inherent device accuracy is optimized through the close proximity of the magnetic field to the Hall transducer. A precise, proportional voltage is provided by the low-offset, chopper-stabilized BiCMOS Hall IC, which is programmed for accuracy after packaging. The output of the device has a positive slope when an increasing current flows through the primary copper conduction path (from pins 1 and 2, to pins 3 and 4), which is the path used for current sensing. The typical internal resistance of this conductive path is 1.2 mΩ, providing low power loss.
The terminals of the conductive path are electrically isolated from the sensor leads (pins 5 through 8). This allows the ACS724 current sensor IC to be used in high-side current-sense applications without the use of high-side differential amplifiers or other costly isolation techniques.
Continued on the next page…
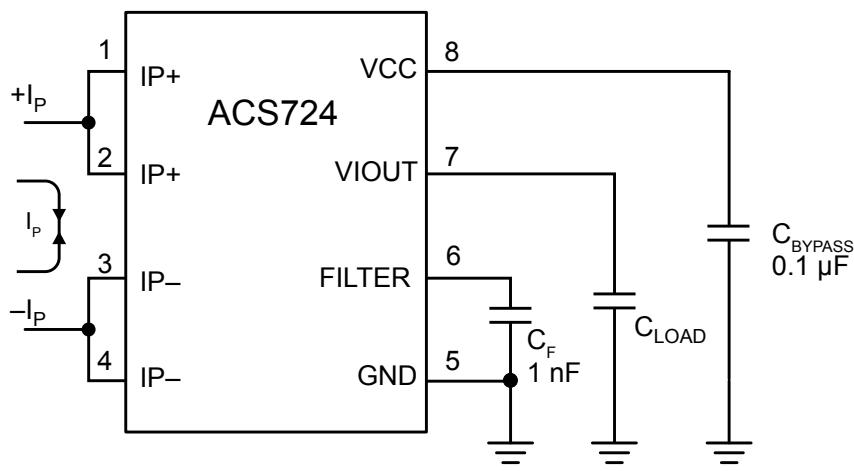
Typical Application
The ACS724 outputs an analog signal, $\mathsf { v } _ { \mathsf { I O U T } } ,$ that changes proportionally with the bidirectional AC or DC primary sensed current, $\tt { I } _ { P } :$ , within the specified measurement range. The FILTER pin can be used to decrease the bandwidth to optimize the noise performance.
FEATURES AND BENEFITS (continued)
• 5 V, single supply operation
• Output voltage proportional to AC or DC current
• Factory-trimmed sensitivity and quiescent output voltage for improved accuracy
• Chopper stabilization results in extremely stable quiescent output voltage
• Nearly zero magnetic hysteresis
• Ratiometric output from supply voltage
DESCRIPTION (continued)
The ACS724 is provided in a small, low-profile surface-mount SOIC8 package. The leadframe is plated with 100% matte tin, which is compatible with standard lead (Pb) free printed circuit board (PCB) assembly processes. Internally, the flip-chip device is considered Pb-free. However, the solder bump connections are available in a Pb-free or high-temperature Pb-based option. Part numbers followed by -S are manufactured with tin-silver-based solder bumps, making these parts Pb-free compliant without the use of RoHS exemptions. Part numbers followed by -T are manufactured with Pb-based solder bumps using allowed RoHS exemptions.
SELECTION GUIDE
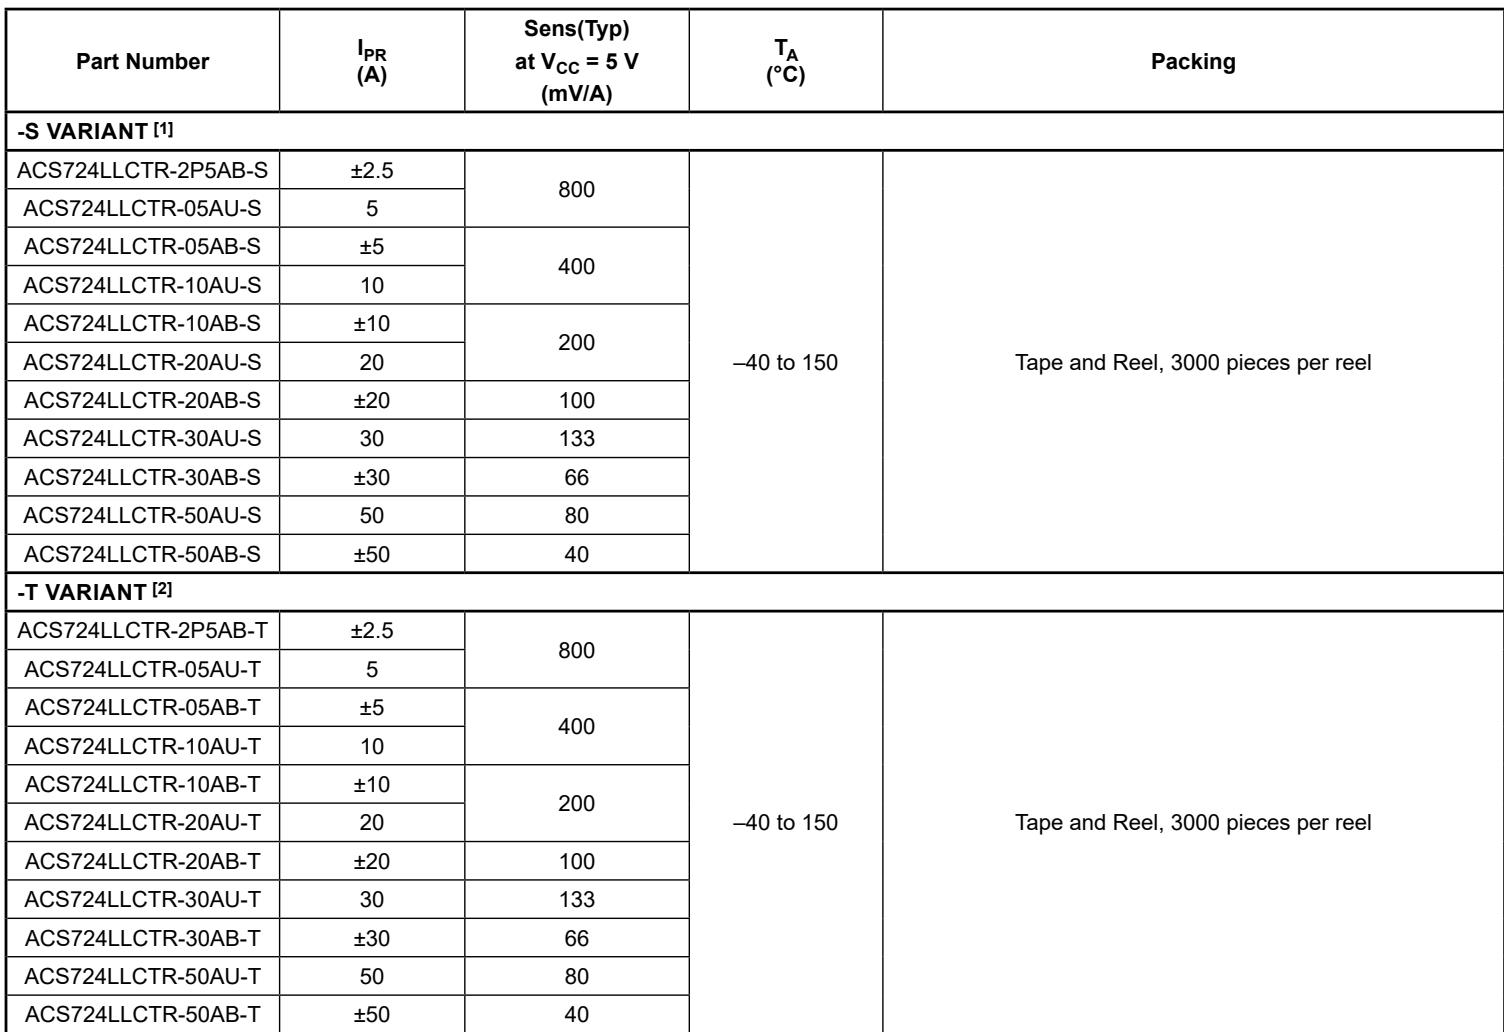
| Part Number | $I_{PR}$ (A) | Sens(Typ)at $V_{CC}=5 V$ (mV/A) | $T_A$ (°C) | Packing |
| -S VARIANT [1] | ||||
| ACS724LLCTR-2P5AB-S | ±2.5 | 800 | -40 to 150 | Tape and Reel, 3000 pieces per reel |
| ACS724LLCTR-05AU-S | 5 | |||
| ACS724LLCTR-05AB-S | ±5 | 400 | ||
| ACS724LLCTR-10AU-S | 10 | |||
| ACS724LLCTR-10AB-S | ±10 | 200 | ||
| ACS724LLCTR-20AU-S | 20 | |||
| ACS724LLCTR-20AB-S | ±20 | 100 | ||
| ACS724LLCTR-30AU-S | 30 | 133 | ||
| ACS724LLCTR-30AB-S | ±30 | 66 | ||
| ACS724LLCTR-50AU-S | 50 | 80 | ||
| ACS724LLCTR-50AB-S | ±50 | 40 | ||
| -T VARIANT [2] | ||||
| ACS724LLCTR-2P5AB-T | ±2.5 | 800 | -40 to 150 | Tape and Reel, 3000 pieces per reel |
| ACS724LLCTR-05AU-T | 5 | |||
| ACS724LLCTR-05AB-T | ±5 | 400 | ||
| ACS724LLCTR-10AU-T | 10 | |||
| ACS724LLCTR-10AB-T | ±10 | 200 | ||
| ACS724LLCTR-20AU-T | 20 | |||
| ACS724LLCTR-20AB-T | ±20 | 100 | ||
| ACS724LLCTR-30AU-T | 30 | 133 | ||
| ACS724LLCTR-30AB-T | ±30 | 66 | ||
| ACS724LLCTR-50AU-T | 50 | 80 | ||
| ACS724LLCTR-50AB-T | ±50 | 40 | ||
[1] -S denotes the lead-free construction with tin-silver-based solder bumps.
[2] -T denotes Pb-contained construction with Pb-based solder bumps. Operating performance of -T and -S devices are identical. -T devices are RoHS-compliant using allowed exemptions provided in Annex III and Annex IV of Directive 2011/65/EU [Exemptions 7(a), 15, 15(a), as applicable].
SPECIFICATIONS
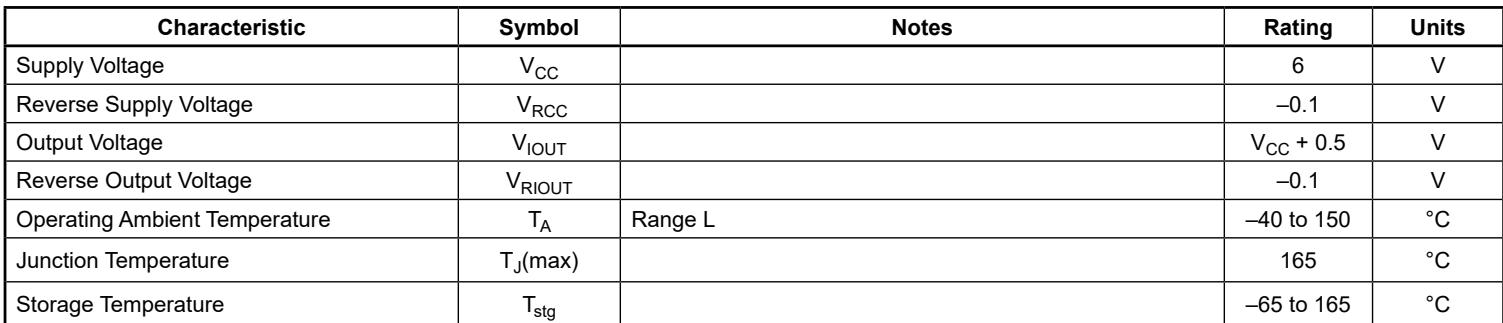
ABSOLUTE MAXIMUM RATINGS
| Characteristic | Symbol | Notes | Rating | Units |
| Supply Voltage | $V_{CC}$ | 6 | V | |
| Reverse Supply Voltage | $V_{RCC}$ | -0.1 | V | |
| Output Voltage | $V_{IOUT}$ | $V_{CC} + 0.5$ | V | |
| Reverse Output Voltage | $V_{RIOUT}$ | -0.1 | V | |
| Operating Ambient Temperature | $T_A$ | Range L | -40 to 150 | °C |
| Junction Temperature | $T_J(max)$ | 165 | °C | |
| Storage Temperature | $T_{stg}$ | -65 to 165 | °C |
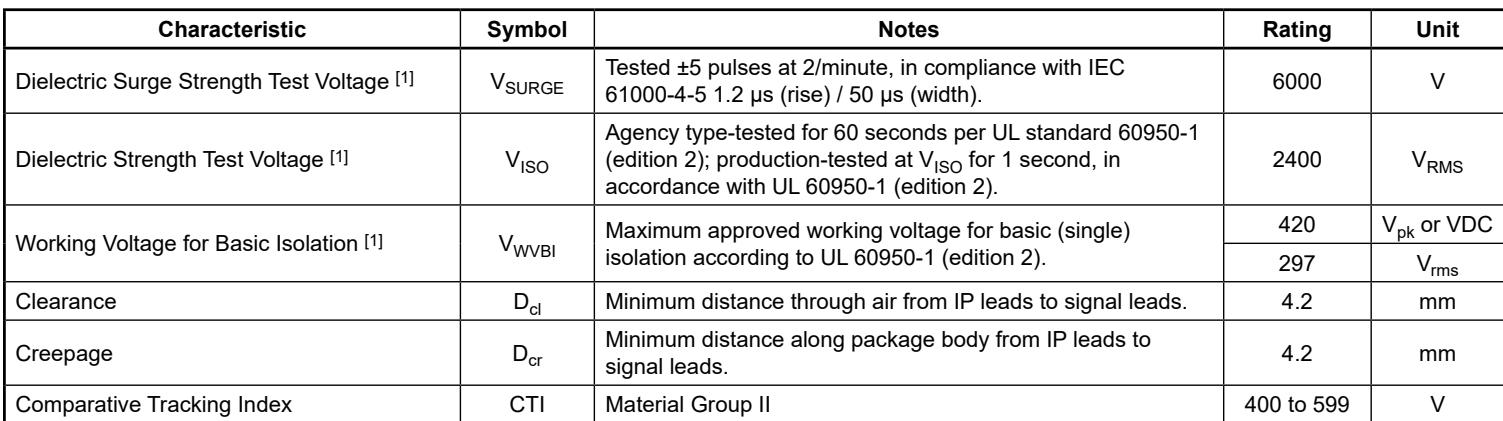
ISOLATION CHARACTERISTICS
| Characteristic | Symbol | Notes | Rating | Unit |
| Dielectric Surge Strength Test Voltage [1] | $V_{SURGE}$ | Tested ±5 pulses at 2/minute, in compliance with IEC 61000-4-5 1.2 μs (rise) / 50 μs (width). | 6000 | V |
| Dielectric Strength Test Voltage [1] | $V_{ISO}$ | Agency type-tested for 60 seconds per UL standard 60950-1 (edition 2); production-tested at $V_{ISO}$ for 1 second, in accordance with UL 60950-1 (edition 2). | 2400 | $V_{RMS}$ |
| Working Voltage for Basic Isolation [1] | $V_{WVBI}$ | Maximum approved working voltage for basic (single) isolation according to UL 60950-1 (edition 2). | 420 | $V_{pk}$ or VDC |
| 297 | $V_{rms}$ | |||
| Clearance | $D_{cl}$ | Minimum distance through air from IP leads to signal leads. | 4.2 | mm |
| Creepage | $D_{cr}$ | Minimum distance along package body from IP leads to signal leads. | 4.2 | mm |
| Comparative Tracking Index | CTI | Material Group II | 400 to 599 | V |
[1] Certification pending.
THERMAL CHARACTERISTICS
| Characteristic | Symbol | Test Conditions [1] | Value | Units |
| Package Thermal Resistance (Junction to Ambient) | $R_{\theta JA}$ | Mounted on the Allegro 85-0740 evaluation board with 1500 mm2 of 4 oz. copper on each side, connected to pins 1 and 2, and to pins 3 and 4, with thermal vias connecting the layers. Performance values include the power consumed by the PCB. | 23 | °C/W |
| Package Thermal Resistance (Junction to Lead) | $R_{\theta JL}$ | Mounted on the Allegro ASEK724 evaluation board. | 5 | °C/W |
[1] Additional thermal information available on the Allegro website.
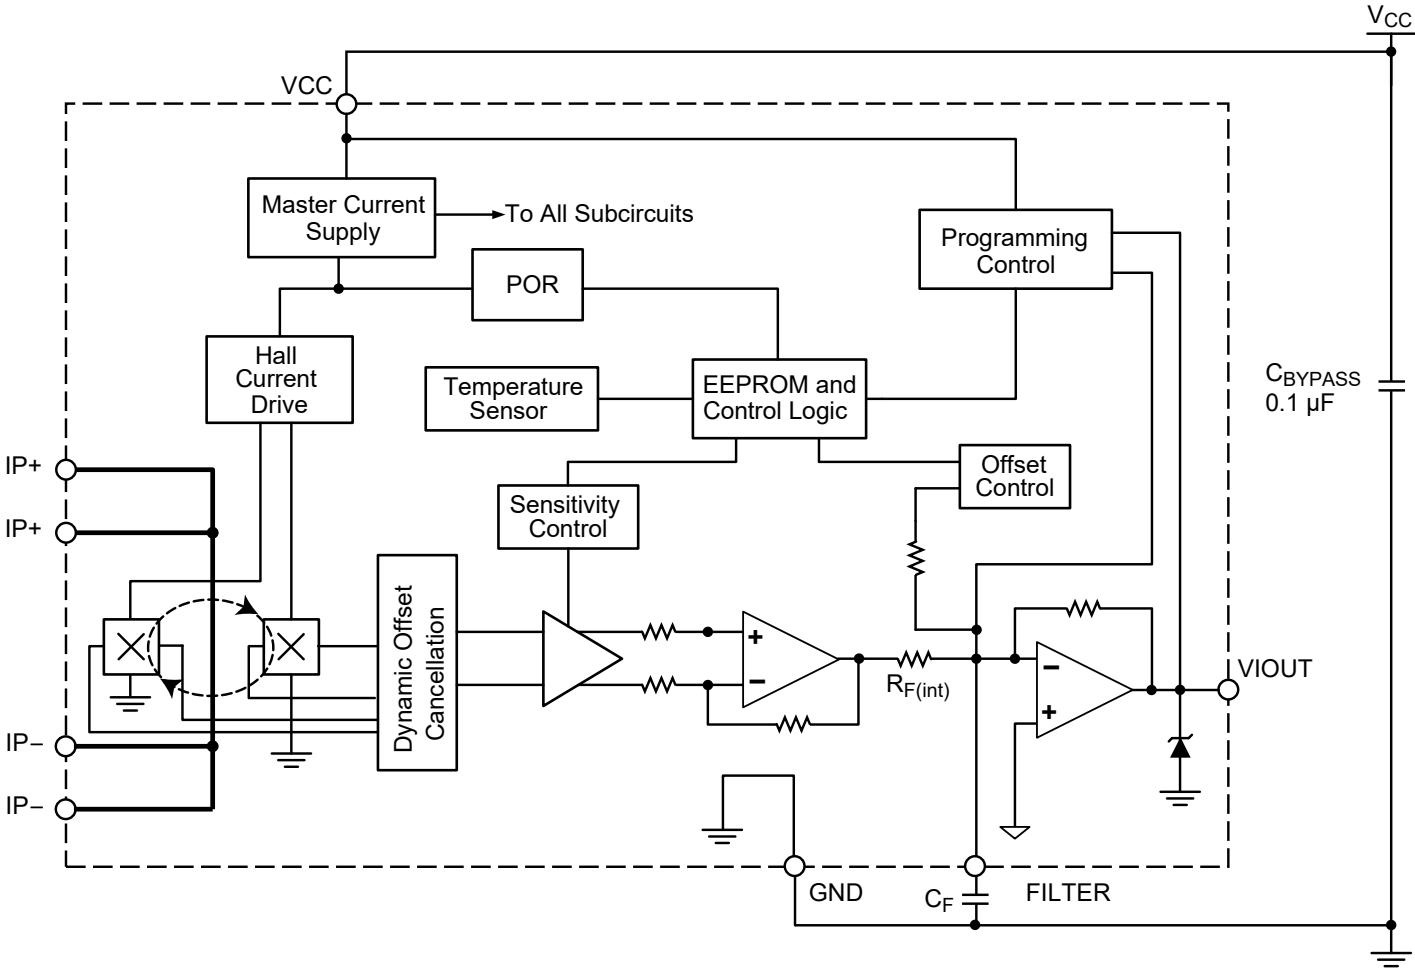
Functional Block Diagram
PINOUT DIAGRAM AND TERMINAL LIST TABLE
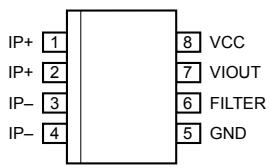
Package LC, 8-Pin SOICN Pinout Diagram
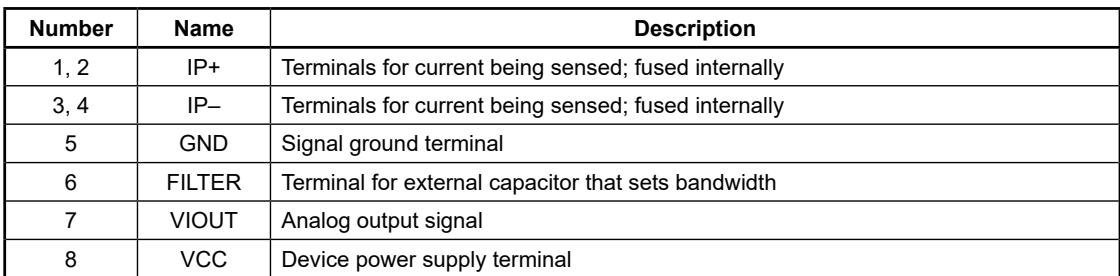
Terminal List Table
| Number | Name | Description |
| 1, 2 | IP+ | Terminals for current being sensed; fused internally |
| 3, 4 | IP- | Terminals for current being sensed; fused internally |
| 5 | GND | Signal ground terminal |
| 6 | FILTER | Terminal for external capacitor that sets bandwidth |
| 7 | VIOUT | Analog output signal |
| 8 | VCC | Device power supply terminal |
COMMON ELECTRICAL CHARACTERISTICS [1]: Valid through the full range of $\mathsf T _ { \mathsf A } , \mathsf V _ { \mathsf C \mathsf C } = 5 \mathsf V , \mathsf C _ { \mathsf F } = 0 .$ unless otherwise specified
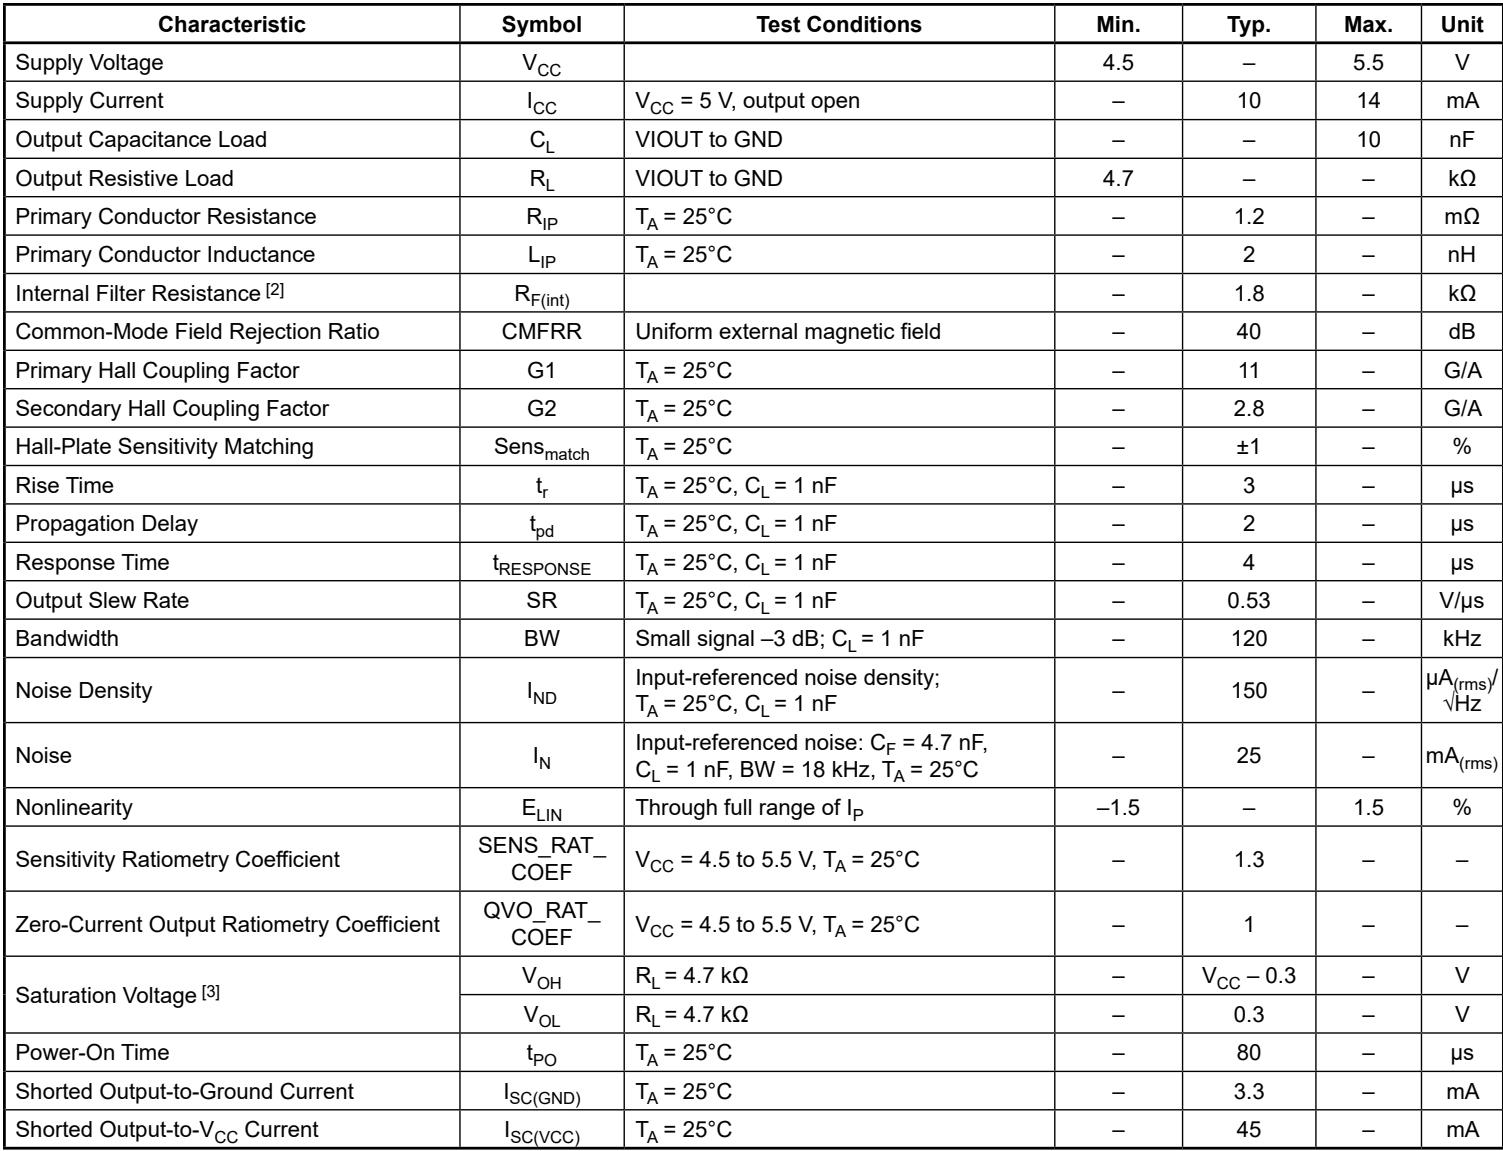
| Characteristic | Symbol | Test Conditions | Min. | Typ. | Max. | Unit |
| Supply Voltage | $V_{CC}$ | 4.5 | - | 5.5 | V | |
| Supply Current | $I_{CC}$ | $V_{CC}=5V, output open$ | - | 10 | 14 | mA |
| Output Capacitance Load | $C_L$ | VIOUT to GND | - | - | 10 | nF |
| Output Resistive Load | $R_L$ | VIOUT to GND | 4.7 | - | - | kΩ |
| Primary Conductor Resistance | $R_{IP}$ | $T_A=25°C$ | - | 1.2 | - | mΩ |
| Primary Conductor Inductance | $L_{IP}$ | $T_A=25°C$ | - | 2 | - | nH |
| Internal Filter Resistance [2] | $R_{F(int)}$ | - | 1.8 | - | kΩ | |
| Common-Mode Field Rejection Ratio | CMFRR | Uniform external magnetic field | - | 40 | - | dB |
| Primary Hall Coupling Factor | G1 | $T_A=25°C$ | - | 11 | - | G/A |
| Secondary Hall Coupling Factor | G2 | $T_A=25°C$ | - | 2.8 | - | G/A |
| Hall-Plate Sensitivity Matching | $Sens_{match}$ | $T_A=25°C$ | - | ±1 | - | % |
| Rise Time | $t_r$ | $T_A=25°C, C_L=1 nF$ | - | 3 | - | μs |
| Propagation Delay | $t_{pd}$ | $T_A=25°C, C_L=1 nF$ | - | 2 | - | μs |
| Response Time | $t_{RESPONSE}$ | $T_A=25°C, C_L=1 nF$ | - | 4 | - | μs |
| Output Slew Rate | SR | $T_A=25°C, C_L=1 nF$ | - | 0.53 | - | V/μs |
| Bandwidth | BW | Small signal -3 dB; $C_L=1 nF$ | - | 120 | - | kHz |
| Noise Density | $I_{ND}$ | Input-referenced noise density; $T_A=25°C, C_L=1 nF$ | - | 150 | - | $μA_{(rms)}/\sqrt{Hz}$ |
| Noise | $I_N$ | Input-referenced noise: $C_F=4.7 nF, C_L=1 nF, BW=18 kHz, T_A=25°C$ | - | 25 | - | $mA_{(rms)}$ |
| Nonlinearity | $E_{LIN}$ | Through full range of $I_P$ | -1.5 | - | 1.5 | % |
| Sensitivity Ratiometry Coefficient | SENS_RAT_COEF | $V_{CC}=4.5 to 5.5 V, T_A=25°C$ | - | 1.3 | - | - |
| Zero-Current Output Ratiometry Coefficient | QVO_RAT_COEF | $V_{CC}=4.5 to 5.5 V, T_A=25°C$ | - | 1 | - | - |
| Saturation Voltage [3] | $V_{OH}$ | $R_L=4.7 kΩ$ | - | $V_{CC}-0.3$ | - | V |
| $V_{OL}$ | $R_L=4.7 kΩ$ | - | 0.3 | - | V | |
| Power-On Time | $t_{PO}$ | $T_A=25°C$ | - | 80 | - | μs |
| Shorted Output-to-Ground Current | $I_{SC(GND)}$ | $T_A=25°C$ | - | 3.3 | - | mA |
| Shorted Output-to- $V_{CC}$ Current | $I_{SC(VCC)}$ | $T_A=25°C$ | - | 45 | - | mA |
[1] Device may be operated at higher primary current levels, ${ \boldsymbol { \mathrm { I } } } _ { \mathsf { P } } ,$ ambient temperatures, ${ \mathsf { T } } _ { \mathsf { A } } ,$ , and internal leadframe temperatures, provided the maximum junction tempera ture, TJ(max), is not exceeded.
[ $\updownarrow \mathsf { R } _ { \mathsf { F ( i n t ) } }$ forms an RC circuit via the FILTER pin.
[3] The sensor IC continues to respond to current beyond the range of I until the high or low saturation voltage; however, the nonlinearity in this region is worse than through the rest of the measurement range.
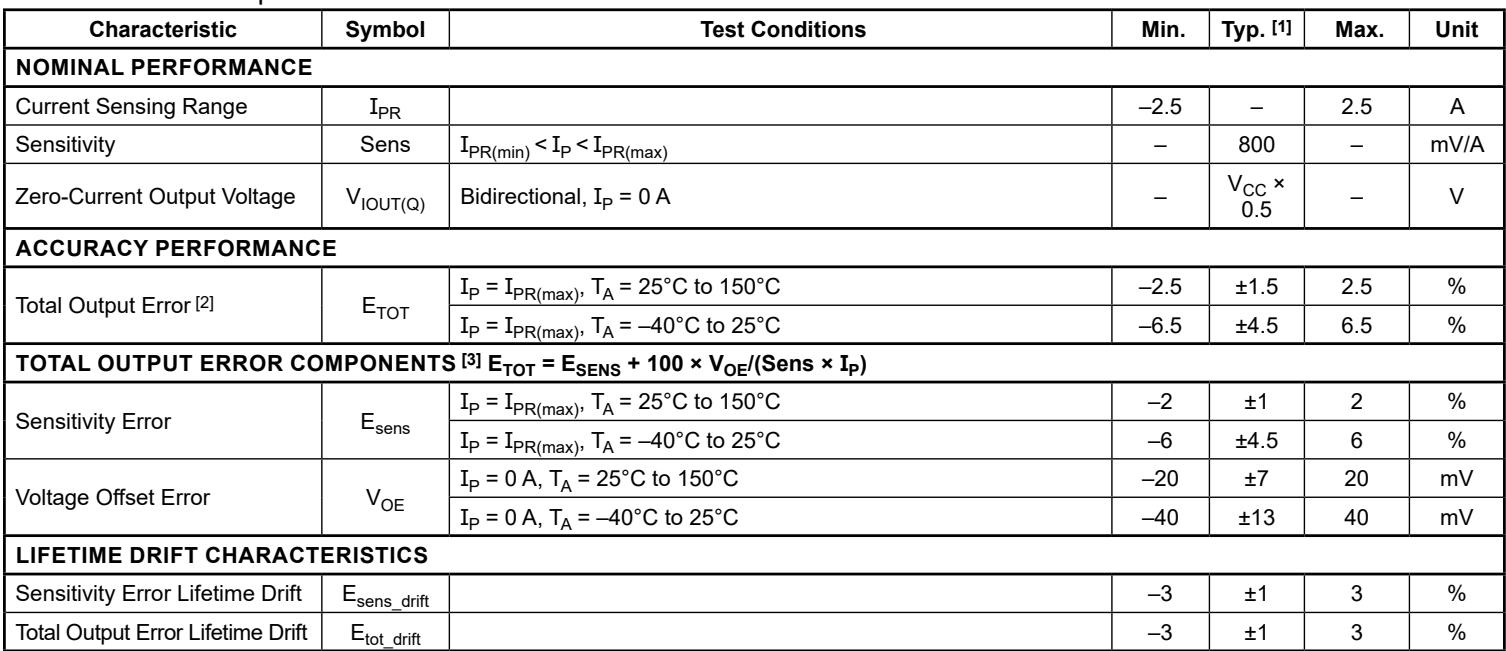
xLLCTR-2P5AB PERFORMANCE CHARACTERISTICS: $\mathsf { T } _ { \mathsf { A } }$ Range L, valid at $\mathsf { T } _ { \mathsf { A } } = - 4 0 ^ { \circ } \mathsf { C }$ to $1 5 0 ^ { \circ } \mathsf { C } ,$ ${ \mathsf { V } } _ { \mathsf { C C } } = 5 { \mathsf { V } } ,$ $\complement _ { \mathsf { F } } = 0 .$ unless otherwise specified
| Characteristic | Symbol | Test Conditions | Min. | Typ. [1] | Max. | Unit |
| NOMINAL PERFORMANCE | ||||||
| Current Sensing Range | $I_{PR}$ | -2.5 | - | 2.5 | A | |
| Sensitivity | Sens | $I_{PR(min)} < I_P < I_{PR(max)}$ | - | 800 | - | mV/A |
| Zero-Current Output Voltage | $V_{IOUT(Q)}$ | Bidirectional, $I_P = 0 A$ | - | $V_{CC} \times 0.5$ | - | V |
| ACCURACY PERFORMANCE | ||||||
| Total Output Error [2] | $E_{TOT}$ | $I_P = I_{PR(max)}, T_A = 25°C to 150°C$ | -2.5 | ±1.5 | 2.5 | % |
| $I_P = I_{PR(max)}, T_A = -40°C to 25°C$ | -6.5 | ±4.5 | 6.5 | % | ||
| TOTAL OUTPUT ERROR COMPONENTS [3] $E_{TOT} = E_{SENS} + 100 \times V_{OE}/(Sens \times I_P)$ | ||||||
| Sensitivity Error | $E_{sens}$ | $I_P = I_{PR(max)}, T_A = 25°C to 150°C$ | -2 | ±1 | 2 | % |
| $I_P = I_{PR(max)}, T_A = -40°C to 25°C$ | -6 | ±4.5 | 6 | % | ||
| Voltage Offset Error | $V_{OE}$ | $I_P = 0 A, T_A = 25°C to 150°C$ | -20 | ±7 | 20 | mV |
| $I_P = 0 A, T_A = -40°C to 25°C$ | -40 | ±13 | 40 | mV | ||
| LIFETIME DRIFT CHARACTERISTICS | ||||||
| Sensitivity Error Lifetime Drift | $E_{sens\_drift}$ | -3 | ±1 | 3 | % | |
| Total Output Error Lifetime Drift | $E_{tot\_drift}$ | -3 | ±1 | 3 | % | |
[1] Typical values with ± are 3-sigma values.
[2] Percentage of ${ \textsc { I } } _ { \mathsf { P } } ,$ with $\mathrm { I } _ { \mathsf { P } } = \mathrm { I } _ { \mathsf { P R } ( \mathsf { m a x } ) } .$
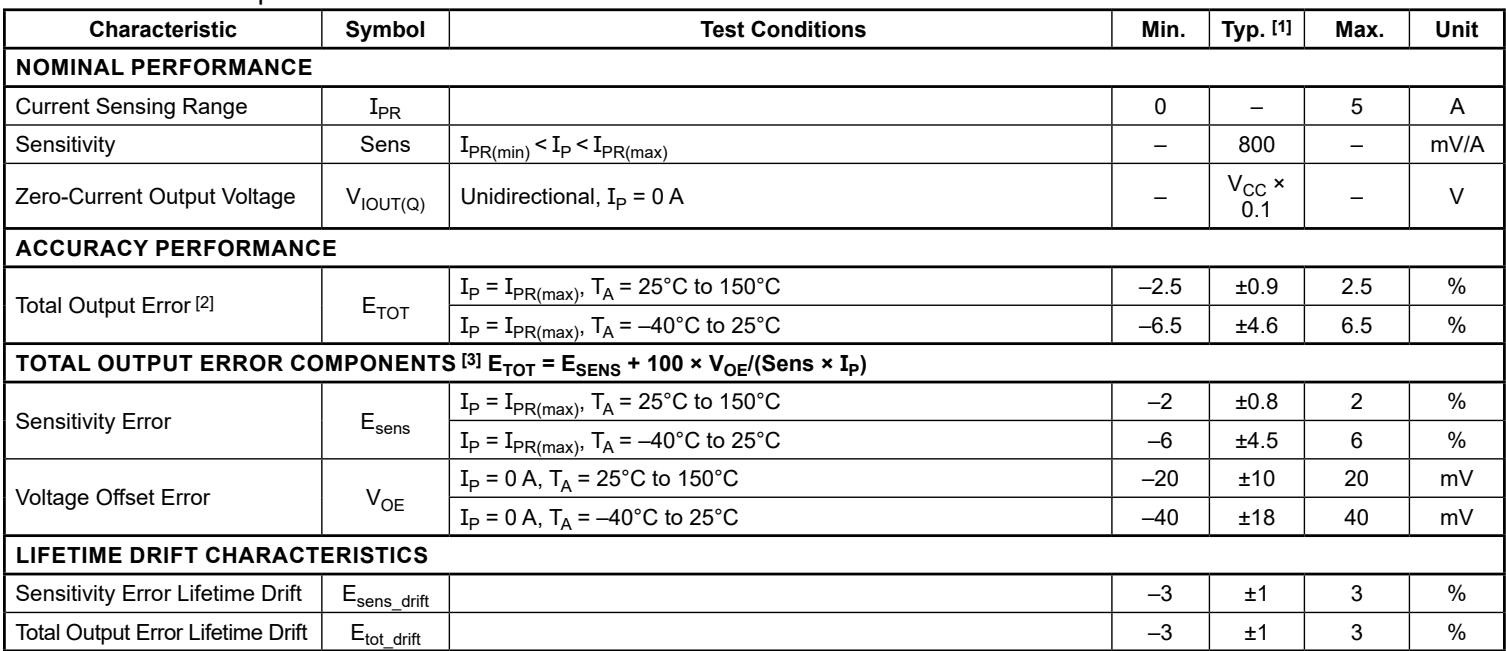
xLLCTR-05AU PERFORMANCE CHARACTERISTICS: $\mathsf { T } _ { \mathsf { A } }$ Range L, valid at $\mathsf { T } _ { \mathsf { A } } = - 4 0 ^ { \circ } \mathsf { C }$ to $1 5 0 ^ { \circ } \mathsf { C }$ $\mathsf { V } _ { \mathsf { C C } } = 5 \mathsf { V } , \mathsf { C } _ { \mathsf { F } } = 0 ,$ unless otherwise specified
| Characteristic | Symbol | Test Conditions | Min. | Typ. [1] | Max. | Unit |
| NOMINAL PERFORMANCE | ||||||
| Current Sensing Range | $I_{PR}$ | 0 | - | 5 | A | |
| Sensitivity | Sens | $I_{PR(min)} < I_P < I_{PR(max)}$ | - | 800 | - | mV/A |
| Zero-Current Output Voltage | $V_{IOUT(Q)}$ | Unidirectional, $I_P = 0 A$ | - | $V_{CC} \times 0.1$ | - | V |
| ACCURACY PERFORMANCE | ||||||
| Total Output Error [2] | $E_{TOT}$ | $I_P = I_{PR(max)}, T_A = 25°C to 150°C$ | -2.5 | ±0.9 | 2.5 | % |
| $I_P = I_{PR(max)}, T_A = -40°C to 25°C$ | -6.5 | ±4.6 | 6.5 | % | ||
| TOTAL OUTPUT ERROR COMPONENTS [3] $E_{TOT} = E_{SENS} + 100 \times V_{OE}/(Sens \times I_P)$ | ||||||
| Sensitivity Error | $E_{sens}$ | $I_P = I_{PR(max)}, T_A = 25°C to 150°C$ | -2 | ±0.8 | 2 | % |
| $I_P = I_{PR(max)}, T_A = -40°C to 25°C$ | -6 | ±4.5 | 6 | % | ||
| Voltage Offset Error | $V_{OE}$ | $I_P = 0 A, T_A = 25°C to 150°C$ | -20 | ±10 | 20 | mV |
| $I_P = 0 A, T_A = -40°C to 25°C$ | -40 | ±18 | 40 | mV | ||
| LIFETIME DRIFT CHARACTERISTICS | ||||||
| Sensitivity Error Lifetime Drift | $E_{sens\_drift}$ | -3 | ±1 | 3 | % | |
| Total Output Error Lifetime Drift | $E_{tot\_drift}$ | -3 | ±1 | 3 | % | |
[1] Typical values with ± are 3-sigma values.
[2] Percentage of ${ \textsc { I } } _ { \mathsf { P } } ,$ with $\mathrm { I } _ { \mathsf { P } } = \mathrm { I } _ { \mathsf { P R } ( \mathsf { m a x } ) } .$
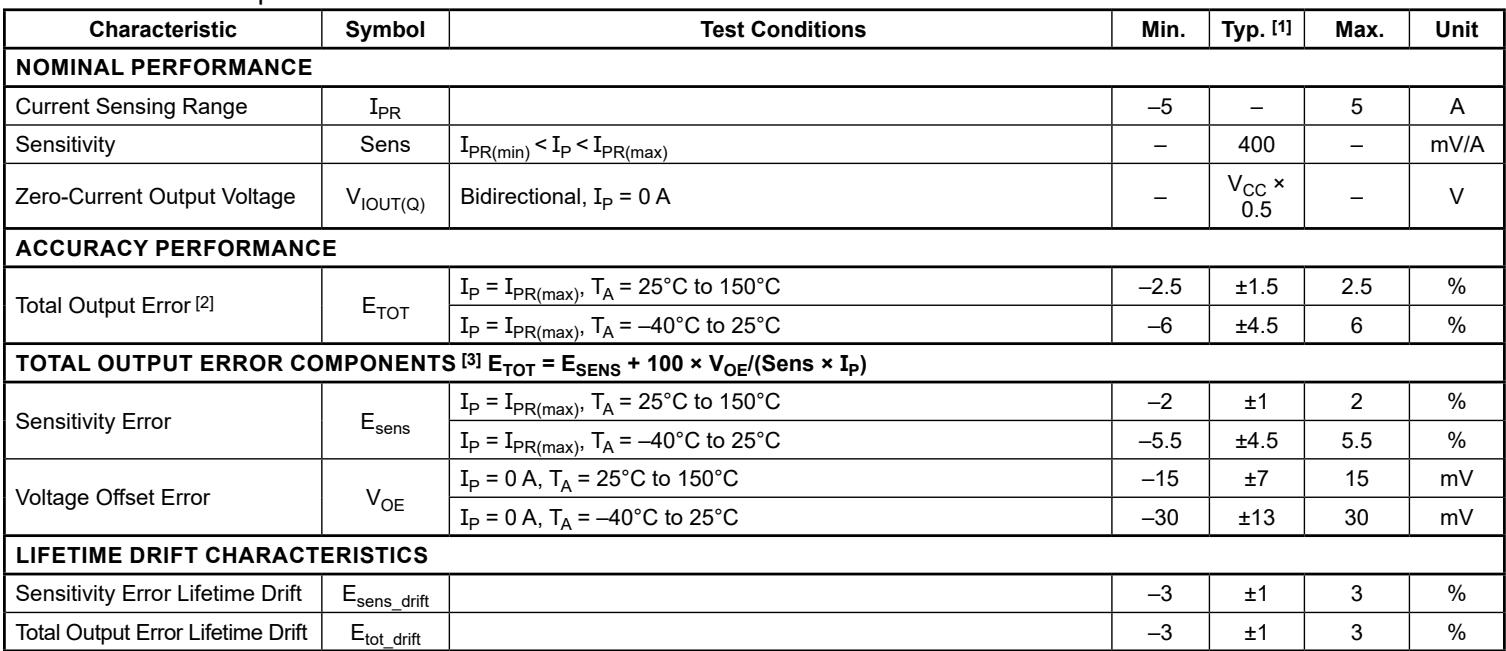
xLLCTR-05AB PERFORMANCE CHARACTERISTICS: $\mathsf { T } _ { \mathsf { A } }$ Range L, valid at $\mathsf { T } _ { \mathsf { A } } = - 4 0 ^ { \circ } \mathsf { C }$ to $1 5 0 ^ { \circ } \mathsf { C }$ $\mathsf { V } _ { \mathsf { C C } } = 5 \mathsf { V } , \mathsf { C } _ { \mathsf { F } } = 0 ,$ unless otherwise specified
| Characteristic | Symbol | Test Conditions | Min. | Typ. [1] | Max. | Unit |
| NOMINAL PERFORMANCE | ||||||
| Current Sensing Range | $I_{PR}$ | -5 | - | 5 | A | |
| Sensitivity | Sens | $I_{PR(min)} < I_P < I_{PR(max)}$ | - | 400 | - | mV/A |
| Zero-Current Output Voltage | $V_{IOUT(Q)}$ | Bidirectional, $I_P = 0 A$ | - | $V_{CC} \times 0.5$ | - | V |
| ACCURACY PERFORMANCE | ||||||
| Total Output Error [2] | $E_{TOT}$ | $I_P = I_{PR(max)}, T_A = 25°C to 150°C$ | -2.5 | ±1.5 | 2.5 | % |
| $I_P = I_{PR(max)}, T_A = -40°C to 25°C$ | -6 | ±4.5 | 6 | % | ||
| TOTAL OUTPUT ERROR COMPONENTS [3] $E_{TOT} = E_{SENS} + 100 \times V_{OE}/(Sens \times I_P)$ | ||||||
| Sensitivity Error | $E_{sens}$ | $I_P = I_{PR(max)}, T_A = 25°C to 150°C$ | -2 | ±1 | 2 | % |
| $I_P = I_{PR(max)}, T_A = -40°C to 25°C$ | -5.5 | ±4.5 | 5.5 | % | ||
| Voltage Offset Error | $V_{OE}$ | $I_P = 0 A, T_A = 25°C to 150°C$ | -15 | ±7 | 15 | mV |
| $I_P = 0 A, T_A = -40°C to 25°C$ | -30 | ±13 | 30 | mV | ||
| LIFETIME DRIFT CHARACTERISTICS | ||||||
| Sensitivity Error Lifetime Drift | $E_{sens\_drift}$ | -3 | ±1 | 3 | % | |
| Total Output Error Lifetime Drift | $E_{tot\_drift}$ | -3 | ±1 | 3 | % | |
[1] Typical values with ± are 3-sigma values.
[2] Percentage of ${ \textsc { I } } _ { \mathsf { P } } ,$ with $\mathrm { I } _ { \mathsf { P } } = \mathrm { I } _ { \mathsf { P R } ( \mathsf { m a x } ) } .$
xLLCTR-10AU PERFORMANCE CHARACTERISTICS: $\mathsf { T } _ { \mathsf { A } }$ Range L, valid at $\mathsf { T } _ { \mathsf { A } } = - 4 0 ^ { \circ } \mathsf { C }$ to $1 5 0 ^ { \circ } \mathsf { C }$ $\mathsf { V } _ { \mathsf { C C } } = 5 \mathsf { V } , \mathsf { C } _ { \mathsf { F } } = 0 ,$ unless otherwise specified
| Characteristic | Symbol | Test Conditions | Min. | Typ. [1] | Max. | Unit |
| NOMINAL PERFORMANCE | ||||||
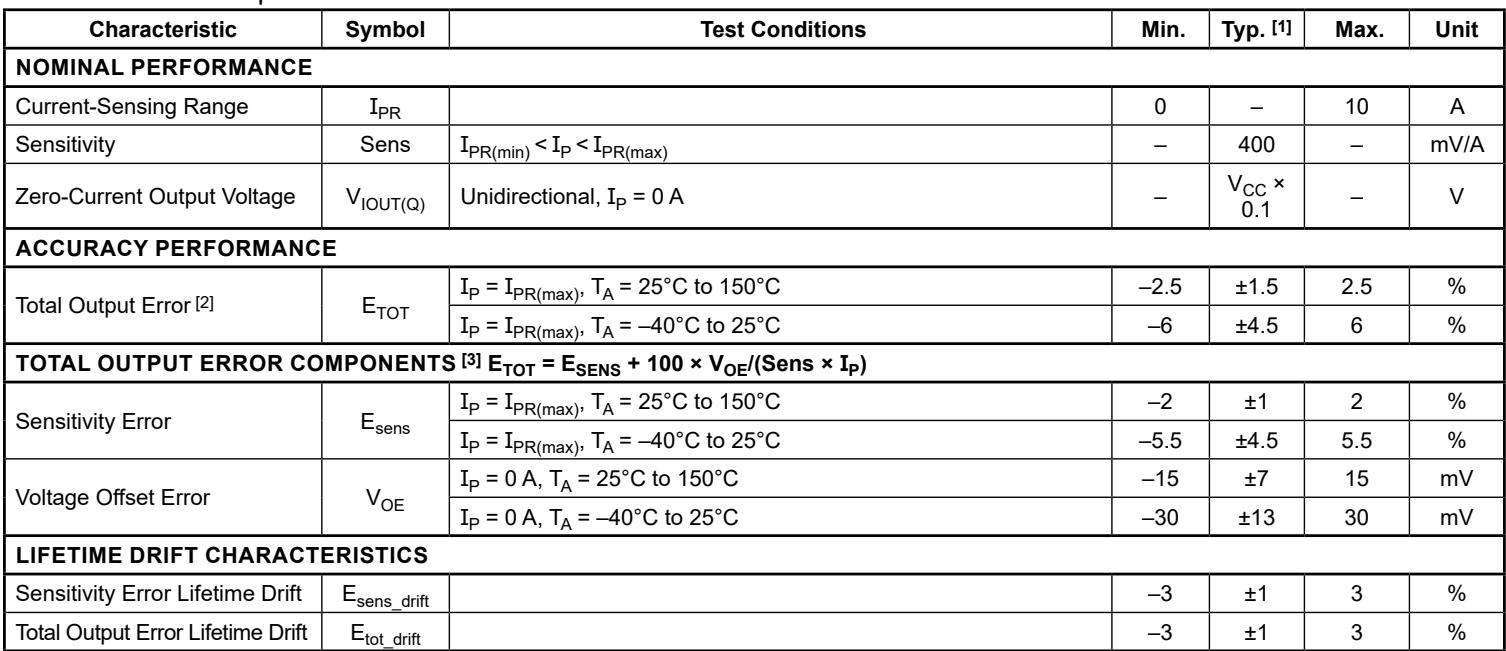
| Current-Sensing Range | $I_{PR}$ | 0 | - | 10 | A | |
| Sensitivity | Sens | $I_{PR(min)} < I_P < I_{PR(max)}$ | - | 400 | - | mV/A |
| Zero-Current Output Voltage | $V_{IOUT(Q)}$ | Unidirectional, $I_P = 0 A$ | - | $V_{CC} \times 0.1$ | - | V |
| ACCURACY PERFORMANCE | ||||||
| Total Output Error [2] | $E_{TOT}$ | $I_P = I_{PR(max)}, T_A = 25°C to 150°C$ | -2.5 | ±1.5 | 2.5 | % |
| $I_P = I_{PR(max)}, T_A = -40°C to 25°C$ | -6 | ±4.5 | 6 | % | ||
| TOTAL OUTPUT ERROR COMPONENTS [3] $E_{TOT} = E_{SENS} + 100 \times V_{OE}/(Sens \times I_P)$ | ||||||
| Sensitivity Error | $E_{sens}$ | $I_P = I_{PR(max)}, T_A = 25°C to 150°C$ | -2 | ±1 | 2 | % |
| $I_P = I_{PR(max)}, T_A = -40°C to 25°C$ | -5.5 | ±4.5 | 5.5 | % | ||
| Voltage Offset Error | $V_{OE}$ | $I_P = 0 A, T_A = 25°C to 150°C$ | -15 | ±7 | 15 | mV |
| $I_P = 0 A, T_A = -40°C to 25°C$ | -30 | ±13 | 30 | mV | ||
| LIFETIME DRIFT CHARACTERISTICS | ||||||
| Sensitivity Error Lifetime Drift | $E_{sens\_drift}$ | -3 | ±1 | 3 | % | |
| Total Output Error Lifetime Drift | $E_{tot\_drift}$ | -3 | ±1 | 3 | % | |
[1] Typical values with ± are 3-sigma values.
[2] Percentage of ${ \textsc { I } } _ { \mathsf { P } } ,$ with $\mathrm { I } _ { \mathsf { P } } = \mathrm { I } _ { \mathsf { P R } ( \mathsf { m a x } ) } .$
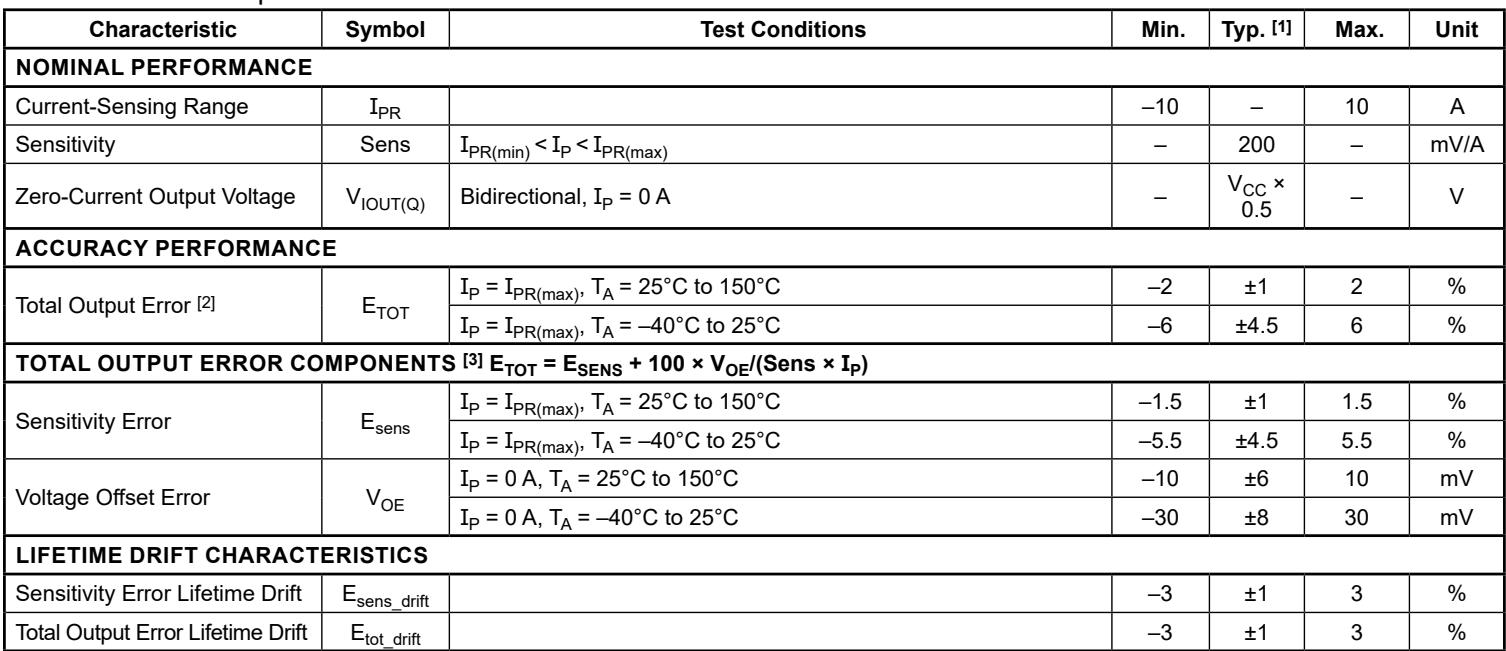
xLLCTR-10AB PERFORMANCE CHARACTERISTICS: $\mathsf { T } _ { \mathsf { A } }$ Range L, valid at $\mathsf { T } _ { \mathsf { A } } = - 4 0 ^ { \circ } \mathsf { C }$ to $1 5 0 ^ { \circ } \mathsf { C }$ $\mathsf { V } _ { \mathsf { C C } } = 5 \mathsf { V } , \mathsf { C } _ { \mathsf { F } } = 0 ,$ unless otherwise specified
| Characteristic | Symbol | Test Conditions | Min. | Typ. [1] | Max. | Unit |
| NOMINAL PERFORMANCE | ||||||
| Current-Sensing Range | $I_{PR}$ | -10 | - | 10 | A | |
| Sensitivity | Sens | $I_{PR(min)} < I_P < I_{PR(max)}$ | - | 200 | - | mV/A |
| Zero-Current Output Voltage | $V_{IOUT(Q)}$ | Bidirectional, $I_P = 0 A$ | - | $V_{CC} \times 0.5$ | - | V |
| ACCURACY PERFORMANCE | ||||||
| Total Output Error [2] | $E_{TOT}$ | $I_P = I_{PR(max)}, T_A = 25°C to 150°C$ | -2 | ±1 | 2 | % |
| $I_P = I_{PR(max)}, T_A = -40°C to 25°C$ | -6 | ±4.5 | 6 | % | ||
| TOTAL OUTPUT ERROR COMPONENTS [3] $E_{TOT} = E_{SENS} + 100 \times V_{OE}/(Sens \times I_P)$ | ||||||
| Sensitivity Error | $E_{sens}$ | $I_P = I_{PR(max)}, T_A = 25°C to 150°C$ | -1.5 | ±1 | 1.5 | % |
| $I_P = I_{PR(max)}, T_A = -40°C to 25°C$ | -5.5 | ±4.5 | 5.5 | % | ||
| Voltage Offset Error | $V_{OE}$ | $I_P = 0 A, T_A = 25°C to 150°C$ | -10 | ±6 | 10 | mV |
| $I_P = 0 A, T_A = -40°C to 25°C$ | -30 | ±8 | 30 | mV | ||
| LIFETIME DRIFT CHARACTERISTICS | ||||||
| Sensitivity Error Lifetime Drift | $E_{sens\_drift}$ | -3 | ±1 | 3 | % | |
| Total Output Error Lifetime Drift | $E_{tot\_drift}$ | -3 | ±1 | 3 | % | |
[1] Typical values with ± are 3-sigma values.
[2] Percentage of IP, with $\mathrm { I } _ { \mathsf { P } } = \mathrm { I } _ { \mathsf { P R } ( \mathsf { m a x } ) } .$
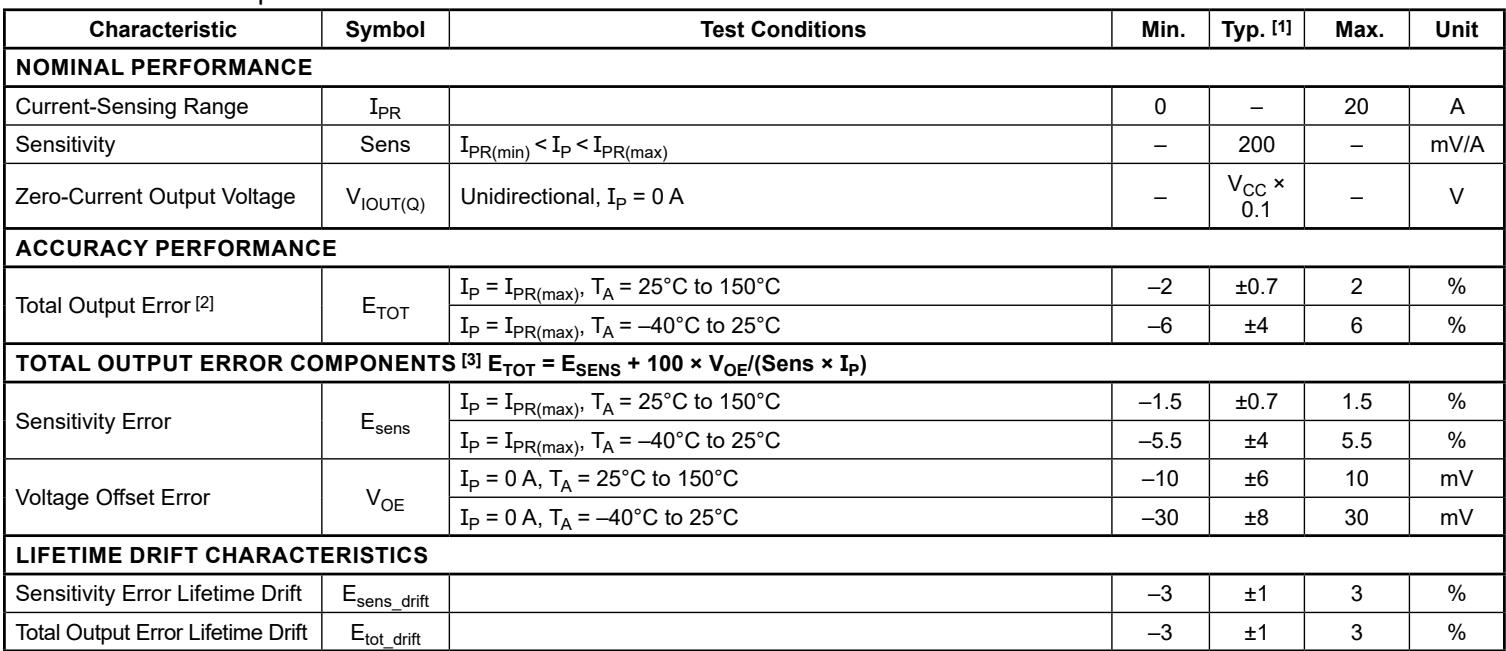
xLLCTR-20AU PERFORMANCE CHARACTERISTICS: $\mathsf { T } _ { \mathsf { A } }$ Range L, valid at $\mathsf { T } _ { \mathsf { A } } = - 4 0 ^ { \circ } \mathsf { C }$ to $1 5 0 ^ { \circ } \mathsf { C }$ $\mathsf { V } _ { \mathsf { C C } } = 5 \mathsf { V } , \mathsf { C } _ { \mathsf { F } } = 0 ,$ unless otherwise specified
| Characteristic | Symbol | Test Conditions | Min. | Typ. [1] | Max. | Unit |
| NOMINAL PERFORMANCE | ||||||
| Current-Sensing Range | $I_{PR}$ | 0 | - | 20 | A | |
| Sensitivity | Sens | $I_{PR(min)} < I_P < I_{PR(max)}$ | - | 200 | - | mV/A |
| Zero-Current Output Voltage | $V_{IOUT(Q)}$ | Unidirectional, $I_P = 0 A$ | - | $V_{CC} \times 0.1$ | - | V |
| ACCURACY PERFORMANCE | ||||||
| Total Output Error [2] | $E_{TOT}$ | $I_P = I_{PR(max)}, T_A = 25°C to 150°C$ | -2 | ±0.7 | 2 | % |
| $I_P = I_{PR(max)}, T_A = -40°C to 25°C$ | -6 | ±4 | 6 | % | ||
| TOTAL OUTPUT ERROR COMPONENTS [3] $E_{TOT} = E_{SENS} + 100 \times V_{OE}/(Sens \times I_P)$ | ||||||
| Sensitivity Error | $E_{sens}$ | $I_P = I_{PR(max)}, T_A = 25°C to 150°C$ | -1.5 | ±0.7 | 1.5 | % |
| $I_P = I_{PR(max)}, T_A = -40°C to 25°C$ | -5.5 | ±4 | 5.5 | % | ||
| Voltage Offset Error | $V_{OE}$ | $I_P = 0 A, T_A = 25°C to 150°C$ | -10 | ±6 | 10 | mV |
| $I_P = 0 A, T_A = -40°C to 25°C$ | -30 | ±8 | 30 | mV | ||
| LIFETIME DRIFT CHARACTERISTICS | ||||||
| Sensitivity Error Lifetime Drift | $E_{sens\_drift}$ | -3 | ±1 | 3 | % | |
| Total Output Error Lifetime Drift | $E_{tot\_drift}$ | -3 | ±1 | 3 | % | |
[1] Typical values with ± are 3-sigma values.
[2] Percentage of ${ \textsc { I } } _ { \mathsf { P } } ,$ with $\mathrm { I } _ { \mathsf { P } } = \mathrm { I } _ { \mathsf { P R } ( \mathsf { m a x } ) } .$
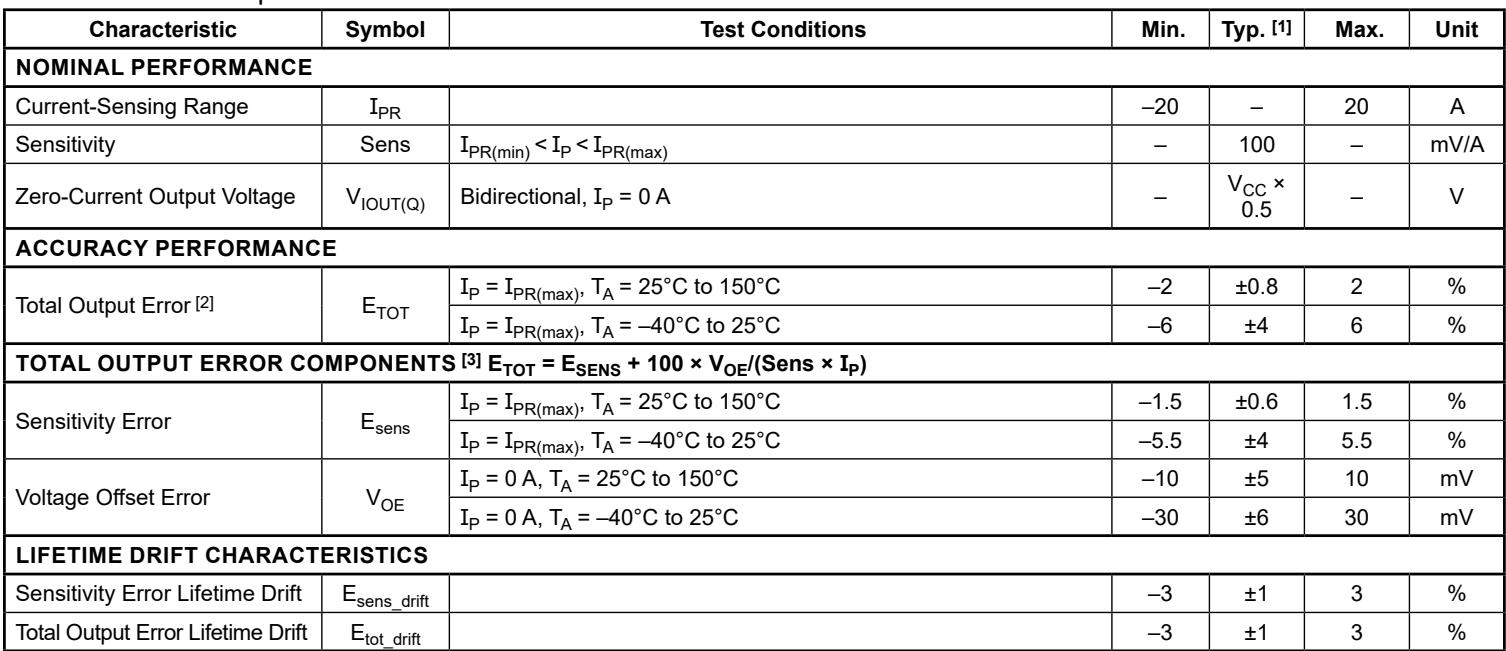
xLLCTR-20AB PERFORMANCE CHARACTERISTICS: $\mathsf { T } _ { \mathsf { A } }$ Range L, valid at $\mathsf { T } _ { \mathsf { A } } = - 4 0 ^ { \circ } \mathsf { C }$ to $1 5 0 ^ { \circ } \mathsf { C }$ $\mathsf { V } _ { \mathsf { C C } } = 5 \mathsf { V } , \mathsf { C } _ { \mathsf { F } } = 0 ,$ unless otherwise specified
| Characteristic | Symbol | Test Conditions | Min. | Typ. [1] | Max. | Unit |
| NOMINAL PERFORMANCE | ||||||
| Current-Sensing Range | $I_{PR}$ | -20 | - | 20 | A | |
| Sensitivity | Sens | $I_{PR(min)} < I_P < I_{PR(max)}$ | - | 100 | - | mV/A |
| Zero-Current Output Voltage | $V_{IOUT(Q)}$ | Bidirectional, $I_P = 0 A$ | - | $V_{CC} \times 0.5$ | - | V |
| ACCURACY PERFORMANCE | ||||||
| Total Output Error [2] | $E_{TOT}$ | $I_P = I_{PR(max)}, T_A = 25°C to 150°C$ | -2 | ±0.8 | 2 | % |
| $I_P = I_{PR(max)}, T_A = -40°C to 25°C$ | -6 | ±4 | 6 | % | ||
| TOTAL OUTPUT ERROR COMPONENTS [3] $E_{TOT} = E_{SENS} + 100 \times V_{OE}/(Sens \times I_P)$ | ||||||
| Sensitivity Error | $E_{sens}$ | $I_P = I_{PR(max)}, T_A = 25°C to 150°C$ | -1.5 | ±0.6 | 1.5 | % |
| $I_P = I_{PR(max)}, T_A = -40°C to 25°C$ | -5.5 | ±4 | 5.5 | % | ||
| Voltage Offset Error | $V_{OE}$ | $I_P = 0 A, T_A = 25°C to 150°C$ | -10 | ±5 | 10 | mV |
| $I_P = 0 A, T_A = -40°C to 25°C$ | -30 | ±6 | 30 | mV | ||
| LIFETIME DRIFT CHARACTERISTICS | ||||||
| Sensitivity Error Lifetime Drift | $E_{sens\_drift}$ | -3 | ±1 | 3 | % | |
| Total Output Error Lifetime Drift | $E_{tot\_drift}$ | -3 | ±1 | 3 | % | |
[1] Typical values with ± are 3-sigma values.
[2] Percentage of ${ \textsc { I } } _ { \mathsf { P } } ,$ with $\mathrm { I } _ { \mathsf { P } } = \mathrm { I } _ { \mathsf { P R } ( \mathsf { m a x } ) } .$
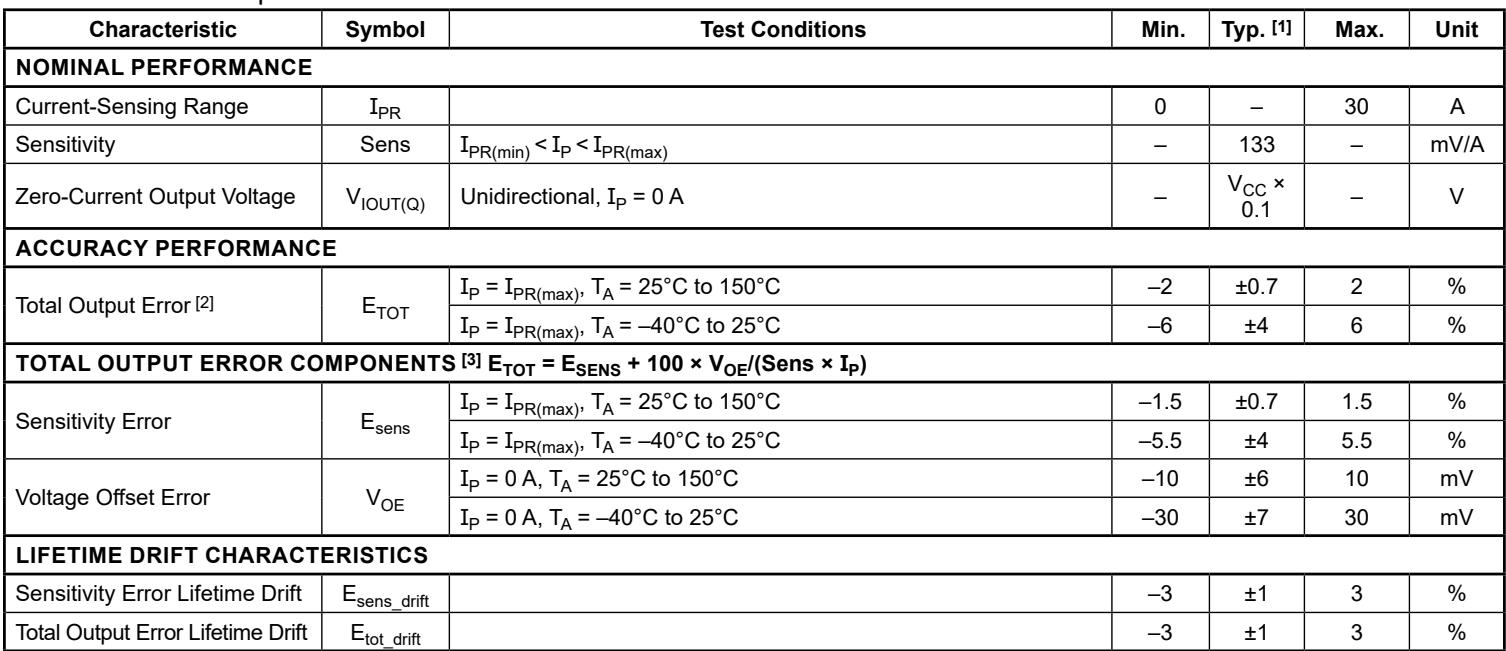
xLLCTR-30AU PERFORMANCE CHARACTERISTICS: $\mathsf { T } _ { \mathsf { A } }$ Range L, valid at $\mathsf { T } _ { \mathsf { A } } = - 4 0 ^ { \circ } \mathsf { C }$ to $1 5 0 ^ { \circ } \mathsf { C } ,$ $\mathsf { V } _ { \mathsf { C C } } = 5 \mathsf { V } , \mathsf { C } _ { \mathsf { F } } = 0$ unless otherwise specified
| Characteristic | Symbol | Test Conditions | Min. | Typ. [1] | Max. | Unit |
| NOMINAL PERFORMANCE | ||||||
| Current-Sensing Range | $I_{PR}$ | 0 | - | 30 | A | |
| Sensitivity | Sens | $I_{PR(min)} < I_P < I_{PR(max)}$ | - | 133 | - | mV/A |
| Zero-Current Output Voltage | $V_{IOUT(Q)}$ | Unidirectional, $I_P = 0 A$ | - | $V_{CC} \times 0.1$ | - | V |
| ACCURACY PERFORMANCE | ||||||
| Total Output Error [2] | $E_{TOT}$ | $I_P = I_{PR(max)}, T_A = 25°C to 150°C$ | -2 | ±0.7 | 2 | % |
| $I_P = I_{PR(max)}, T_A = -40°C to 25°C$ | -6 | ±4 | 6 | % | ||
| TOTAL OUTPUT ERROR COMPONENTS [3] $E_{TOT} = E_{SENS} + 100 \times V_{OE}/(Sens \times I_P)$ | ||||||
| Sensitivity Error | $E_{sens}$ | $I_P = I_{PR(max)}, T_A = 25°C to 150°C$ | -1.5 | ±0.7 | 1.5 | % |
| $I_P = I_{PR(max)}, T_A = -40°C to 25°C$ | -5.5 | ±4 | 5.5 | % | ||
| Voltage Offset Error | $V_{OE}$ | $I_P = 0 A, T_A = 25°C to 150°C$ | -10 | ±6 | 10 | mV |
| $I_P = 0 A, T_A = -40°C to 25°C$ | -30 | ±7 | 30 | mV | ||
| LIFETIME DRIFT CHARACTERISTICS | ||||||
| Sensitivity Error Lifetime Drift | $E_{sens\_drift}$ | -3 | ±1 | 3 | % | |
| Total Output Error Lifetime Drift | $E_{tot\_drift}$ | -3 | ±1 | 3 | % | |
[1] Typical values with ± are 3-sigma values.
[2] Percentage of IP, with $\mathrm { I } _ { \mathsf { P } } = \mathrm { I } _ { \mathsf { P R } ( \mathsf { m a x } ) } .$
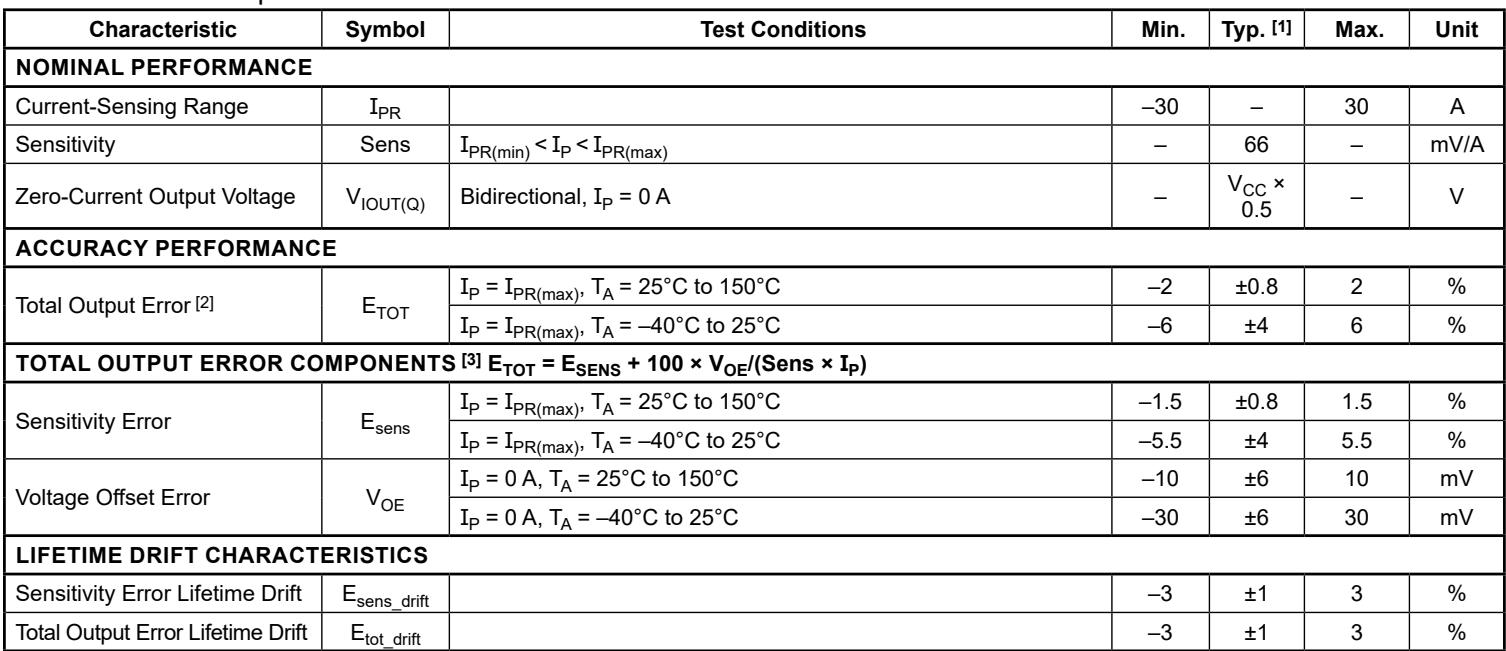
xLLCTR-30AB PERFORMANCE CHARACTERISTICS: $\mathsf { T } _ { \mathsf { A } }$ Range L, valid at $\mathsf { T } _ { \mathsf { A } } = - 4 0 ^ { \circ } \mathsf { C }$ to $1 5 0 ^ { \circ } \mathsf { C }$ $\mathsf { V } _ { \mathsf { C C } } = 5 \mathsf { V } , \mathsf { C } _ { \mathsf { F } } = 0 ,$ unless otherwise specified
| Characteristic | Symbol | Test Conditions | Min. | Typ. [1] | Max. | Unit |
| NOMINAL PERFORMANCE | ||||||
| Current-Sensing Range | $I_{PR}$ | -30 | - | 30 | A | |
| Sensitivity | Sens | $I_{PR(min)} < I_P < I_{PR(max)}$ | - | 66 | - | mV/A |
| Zero-Current Output Voltage | $V_{IOUT(Q)}$ | Bidirectional, $I_P = 0 A$ | - | $V_{CC} \times 0.5$ | - | V |
| ACCURACY PERFORMANCE | ||||||
| Total Output Error [2] | $E_{TOT}$ | $I_P = I_{PR(max)}, T_A = 25°C to 150°C$ | -2 | ±0.8 | 2 | % |
| $I_P = I_{PR(max)}, T_A = -40°C to 25°C$ | -6 | ±4 | 6 | % | ||
| TOTAL OUTPUT ERROR COMPONENTS [3] $E_{TOT} = E_{SENS} + 100 \times V_{OE}/(Sens \times I_P)$ | ||||||
| Sensitivity Error | $E_{sens}$ | $I_P = I_{PR(max)}, T_A = 25°C to 150°C$ | -1.5 | ±0.8 | 1.5 | % |
| $I_P = I_{PR(max)}, T_A = -40°C to 25°C$ | -5.5 | ±4 | 5.5 | % | ||
| Voltage Offset Error | $V_{OE}$ | $I_P = 0 A, T_A = 25°C to 150°C$ | -10 | ±6 | 10 | mV |
| $I_P = 0 A, T_A = -40°C to 25°C$ | -30 | ±6 | 30 | mV | ||
| LIFETIME DRIFT CHARACTERISTICS | ||||||
| Sensitivity Error Lifetime Drift | $E_{sens\_drift}$ | -3 | ±1 | 3 | % | |
| Total Output Error Lifetime Drift | $E_{tot\_drift}$ | -3 | ±1 | 3 | % | |
[1] Typical values with ± are 3-sigma values.
[2] Percentage of ${ \textsc { I } } _ { \mathsf { P } } ,$ with $\mathrm { I } _ { \mathsf { P } } = \mathrm { I } _ { \mathsf { P R } ( \mathsf { m a x } ) } .$
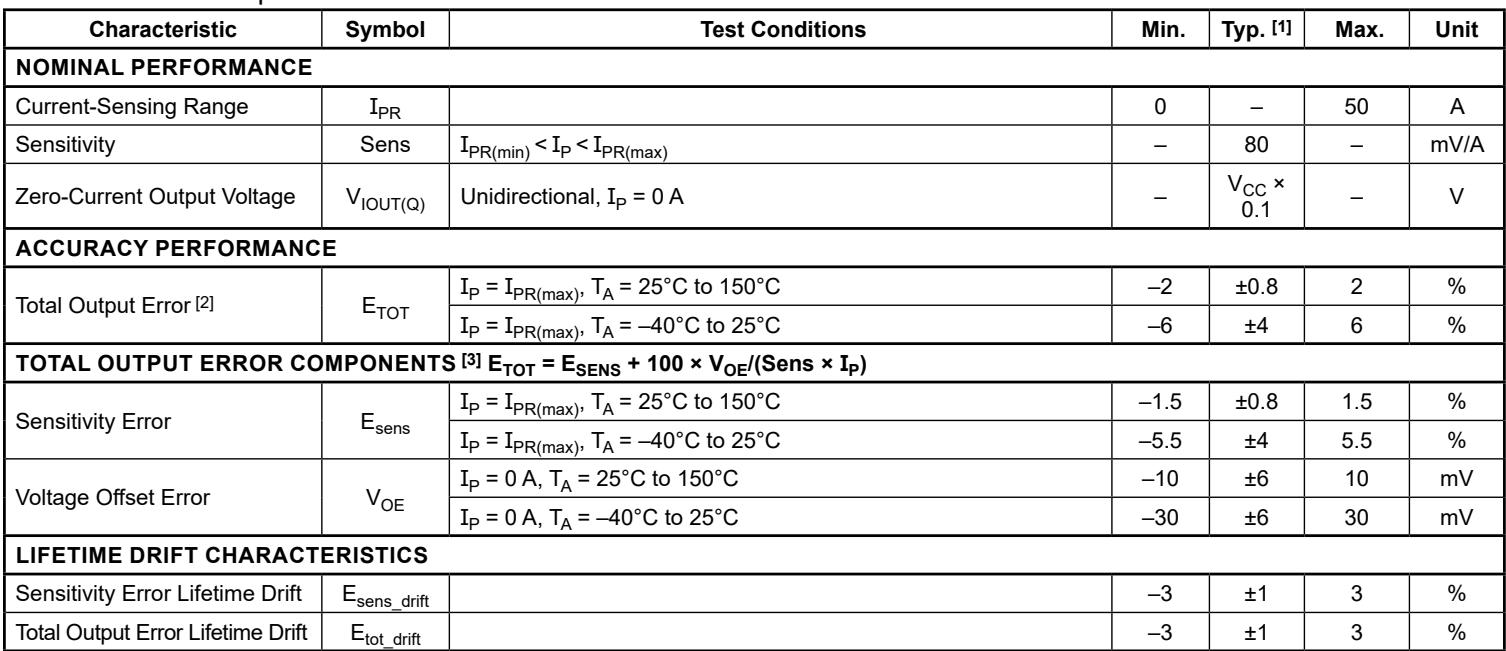
xLLCTR-50AU PERFORMANCE CHARACTERISTICS: $\mathsf { T } _ { \mathsf { A } }$ Range L, valid at $\mathsf { T } _ { \mathsf { A } } = - 4 0 ^ { \circ } \mathsf { C }$ to $1 5 0 ^ { \circ } \mathsf { C }$ $\mathsf { V } _ { \mathsf { C C } } = 5 \mathsf { V } , \mathsf { C } _ { \mathsf { F } } = 0 ,$ unless otherwise specified
| Characteristic | Symbol | Test Conditions | Min. | Typ. [1] | Max. | Unit |
| NOMINAL PERFORMANCE | ||||||
| Current-Sensing Range | $I_{PR}$ | 0 | - | 50 | A | |
| Sensitivity | Sens | $I_{PR(min)} < I_P < I_{PR(max)}$ | - | 80 | - | mV/A |
| Zero-Current Output Voltage | $V_{IOUT(Q)}$ | Unidirectional, $I_P = 0 A$ | - | $V_{CC} \times 0.1$ | - | V |
| ACCURACY PERFORMANCE | ||||||
| Total Output Error [2] | $E_{TOT}$ | $I_P = I_{PR(max)}, T_A = 25°C to 150°C$ | -2 | ±0.8 | 2 | % |
| $I_P = I_{PR(max)}, T_A = -40°C to 25°C$ | -6 | ±4 | 6 | % | ||
| TOTAL OUTPUT ERROR COMPONENTS [3] $E_{TOT} = E_{SENS} + 100 \times V_{OE}/(Sens \times I_P)$ | ||||||
| Sensitivity Error | $E_{sens}$ | $I_P = I_{PR(max)}, T_A = 25°C to 150°C$ | -1.5 | ±0.8 | 1.5 | % |
| $I_P = I_{PR(max)}, T_A = -40°C to 25°C$ | -5.5 | ±4 | 5.5 | % | ||
| Voltage Offset Error | $V_{OE}$ | $I_P = 0 A, T_A = 25°C to 150°C$ | -10 | ±6 | 10 | mV |
| $I_P = 0 A, T_A = -40°C to 25°C$ | -30 | ±6 | 30 | mV | ||
| LIFETIME DRIFT CHARACTERISTICS | ||||||
| Sensitivity Error Lifetime Drift | $E_{sens\_drift}$ | -3 | ±1 | 3 | % | |
| Total Output Error Lifetime Drift | $E_{tot\_drift}$ | -3 | ±1 | 3 | % | |
[1] Typical values with ± are 3-sigma values.
[2] Percentage of ${ \textsc { I } } _ { \mathsf { P } } ,$ with $\mathrm { I } _ { \mathsf { P } } = \mathrm { I } _ { \mathsf { P R } ( \mathsf { m a x } ) } .$
xLLCTR-50AB PERFORMANCE CHARACTERISTICS: $\mathsf { T } _ { \mathsf { A } }$ Range L, valid at $\mathsf { T } _ { \mathsf { A } } = - 4 0 ^ { \circ } \mathsf { C }$ to $1 5 0 ^ { \circ } \mathsf { C }$ $\mathsf { V } _ { \mathsf { C C } } = 5 \mathsf { V } , \mathsf { C } _ { \mathsf { F } } = 0 ,$ unless otherwise specified
| Characteristic | Symbol | Test Conditions | Min. | Typ. [1] | Max. | Unit |
| NOMINAL PERFORMANCE | ||||||
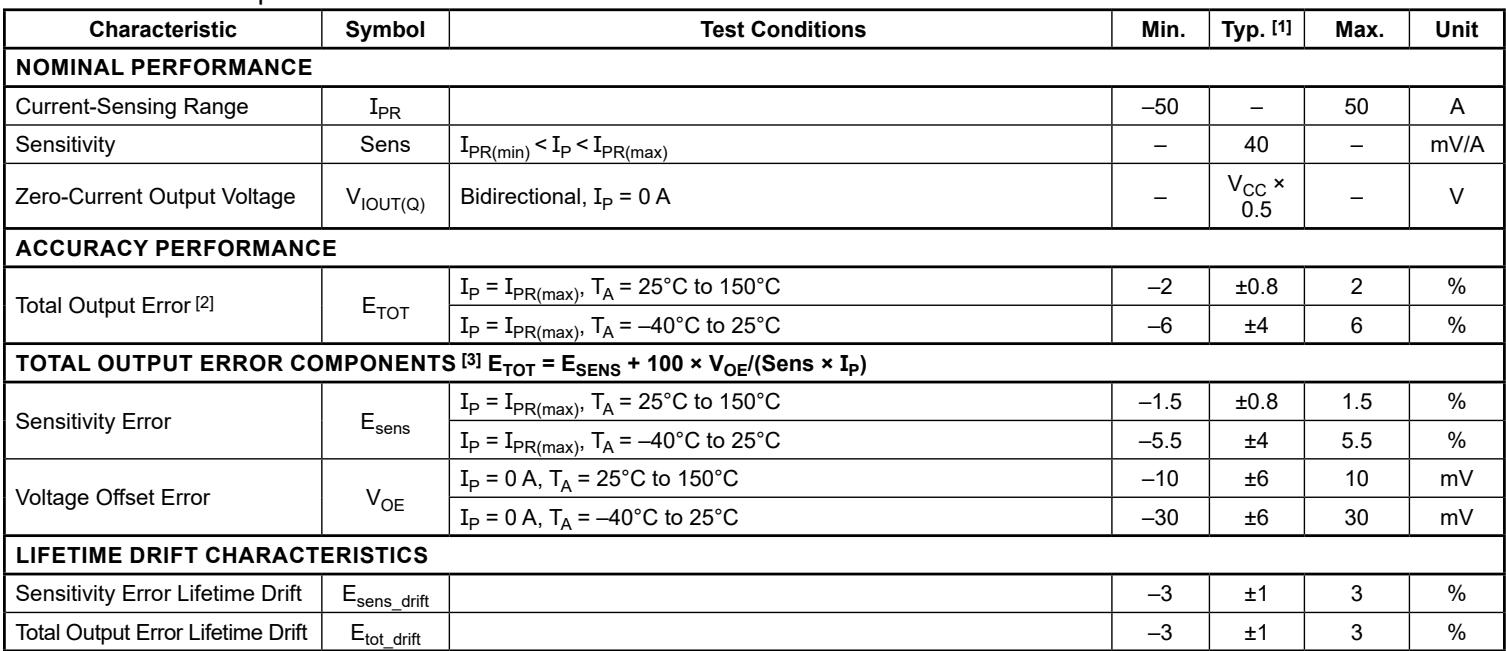
| Current-Sensing Range | $I_{PR}$ | -50 | - | 50 | A | |
| Sensitivity | Sens | $I_{PR(min)} < I_P < I_{PR(max)}$ | - | 40 | - | mV/A |
| Zero-Current Output Voltage | $V_{IOUT(Q)}$ | Bidirectional, $I_P = 0 A$ | - | $V_{CC} \times 0.5$ | - | V |
| ACCURACY PERFORMANCE | ||||||
| Total Output Error [2] | $E_{TOT}$ | $I_P = I_{PR(max)}, T_A = 25°C to 150°C$ | -2 | ±0.8 | 2 | % |
| $I_P = I_{PR(max)}, T_A = -40°C to 25°C$ | -6 | ±4 | 6 | % | ||
| TOTAL OUTPUT ERROR COMPONENTS [3] $E_{TOT} = E_{SENS} + 100 \times V_{OE}/(Sens \times I_P)$ | ||||||
| Sensitivity Error | $E_{sens}$ | $I_P = I_{PR(max)}, T_A = 25°C to 150°C$ | -1.5 | ±0.8 | 1.5 | % |
| $I_P = I_{PR(max)}, T_A = -40°C to 25°C$ | -5.5 | ±4 | 5.5 | % | ||
| Voltage Offset Error | $V_{OE}$ | $I_P = 0 A, T_A = 25°C to 150°C$ | -10 | ±6 | 10 | mV |
| $I_P = 0 A, T_A = -40°C to 25°C$ | -30 | ±6 | 30 | mV | ||
| LIFETIME DRIFT CHARACTERISTICS | ||||||
| Sensitivity Error Lifetime Drift | $E_{sens\_drift}$ | -3 | ±1 | 3 | % | |
| Total Output Error Lifetime Drift | $E_{tot\_drift}$ | -3 | ±1 | 3 | % | |
[1] Typical values with ± are 3-sigma values.
[2] Percentage of ${ \textsc { I } } _ { \mathsf { P } } ,$ with $\mathrm { I } _ { \mathsf { P } } = \mathrm { I } _ { \mathsf { P R } ( \mathsf { m a x } ) } .$
CHARACTERISTIC PERFORMANCE ACS724 TYPICAL FREQUENCY RESPONSE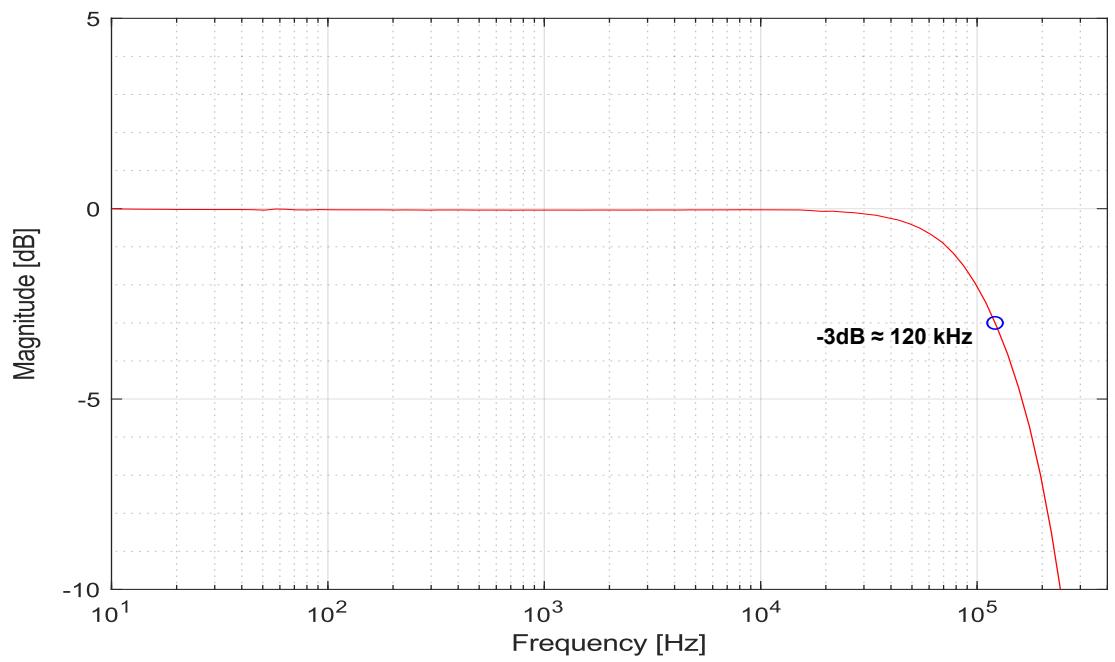
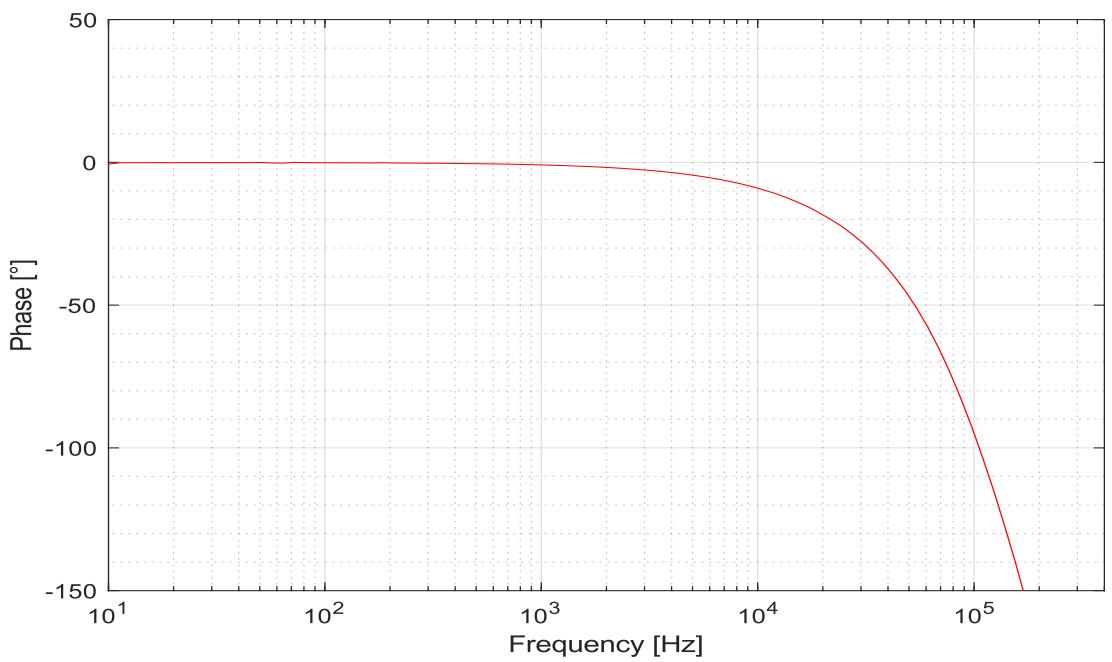
For information regarding bandwidth characterization methods used for the ACS724, see the “Characterizing System Bandwidth” application note (https://allegromicro.com/en/insights-and-innovations/technical-documents/hall-effect-sensor-ic-publications/aneffective-method-for-characterizing-system-bandwidth-an296169) on the Allegro website.
RESPONSE CHARACTERISTICS DEFINITIONS AND PERFORMANCE DATA
Response Time (tRESPONSE)
The time between a) when the sensed input current reaches 90% of its final value, and b) when the sensor output reaches 90% of its full-scale value.
Propagation Delay $( \mathbf { t _ { p d } } )$
The time between a) when the sensed input current reaches 20% of its full-scale value, and b) when the sensor output reaches 20% of its full-scale value.
Rise Time (tr)
The time between a) when the sensor reaches 10% of its fullscale value, and b) when the sensor reaches 90% of its full-scale value.
Output Slew Rate (SR)
The rate of change [V/µs] in the output voltage from a) when the sensor reaches 10% of its full-scale value, and b) when the sensor reaches 90% of its full-scale value.
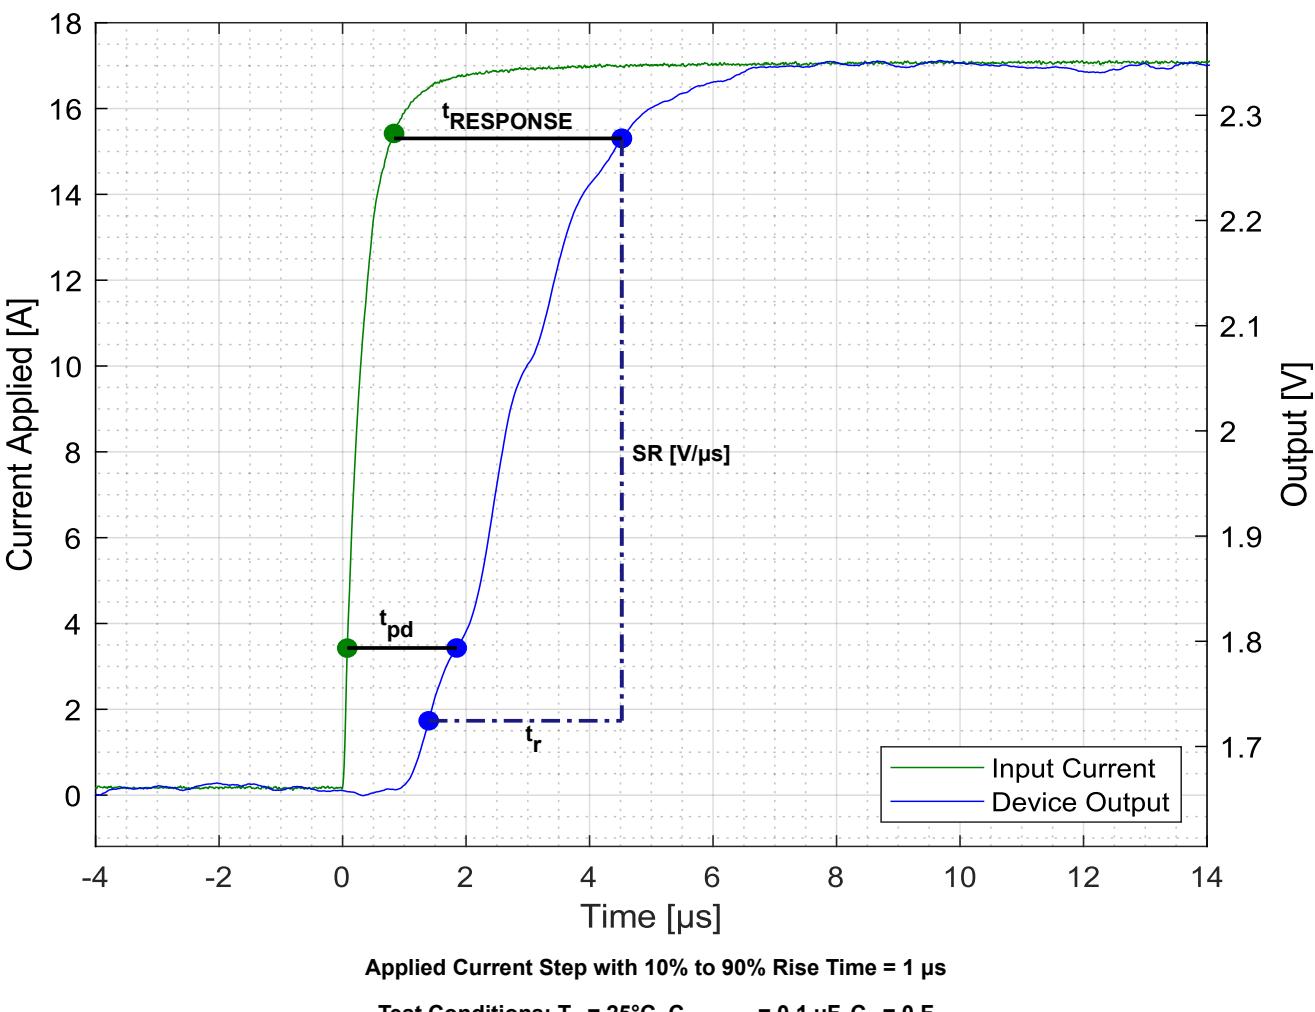
Response Time, Propagation Delay, Rise Time, and Output Slew Rate
POWER ON FUNCTIONAL DESCRIPTION AND PERFORMANCE DATA
Power-On Time (tPO)
When the supply is ramped to its operating voltage, the device requires a finite period of time to power its internal components before it responds to an input magnetic field. Power-on time (tPO) is defined as the time between a) when the power supply has reached its minimum specified operating voltage (VCC(min)), and b) when the sensor output has settled to within ±10% of its steady-state value when a magnetic field is applied.
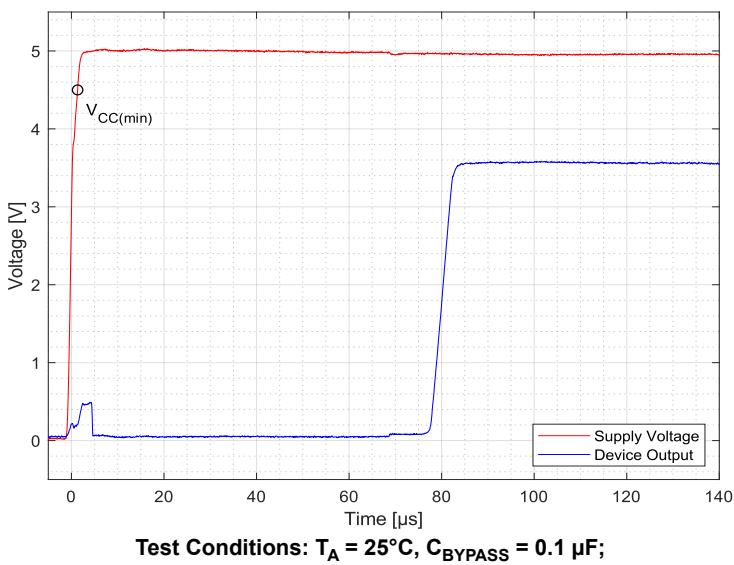
RPD = 10 kΩ, 1 V Output Swing
Figure 1: Power-On Time (tPO)
Power-On Profile
After applying power, the part remains off in a known state referred to as power-on reset, POR. The device remains in this state until the voltage reaches a point at which the device can remain powered. The intended power-on and power-off profile is shown in Figure 2, where a pull-down resistor is used on the output of the tested device.
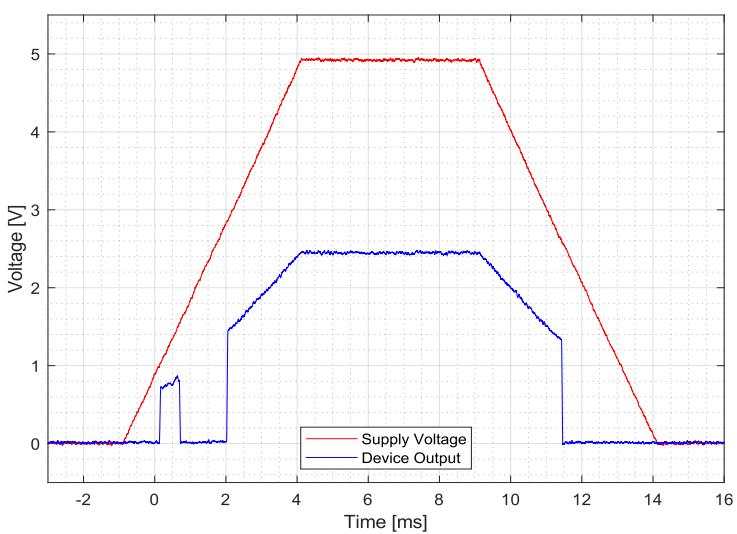
Supply Voltage Ramp Rate = 1 V/ms Test Conditions: $\mathsf { T } _ { \mathsf { A } } = 2 5 ^ { \circ } \mathsf { C } , \mathsf { C } _ { \mathsf { B Y P A S S } } = 0 . 1 \mu \mathsf { F } , \mathsf { R } _ { \mathsf { P D } } = 1 0 \ k \Omega$
Figure 2: Power-On Profile
APPLICATION INFORMATION
Estimating Total Error vs. Sensed Current
The Performance Characteristics tables give distribution (±3 sigma) values for total error at $\mathrm { { I } _ { P R ( m a x ) } . }$ The expected error at a particular current can be estimated using the distribution data for the components of total error, sensitivity error, and voltage offset error. The ±3-sigma value for total error $( \mathrm { E _ { T O T } } )$ as a function of the sensed current $\mathrm { ( I _ { P } ) }$ is estimated as:
$$
E _ {T O T} \left(I _ {P}\right) = \sqrt {E _ {S E N S} ^ {2} + \left(\frac {1 0 0 \times V _ {O E}}{S e n s \times I _ {P}}\right) ^ {2}}
$$
Here, $\mathrm { E } _ { \mathrm { S E N S } }$ and $\mathrm { V _ { O E } }$ are the ±3-sigma values for those error terms. If there is an average sensitivity error or average offset voltage, the average total error is estimated as:
$$
E _ {T O T _ {A V G}} \left(I _ {P}\right) = E _ {S E N S _ {A V G}} + \frac {1 0 0 \times V _ {O E _ {A V G}}}{\text { Sens } \times I _ {P}}
$$
The resulting total error is a sum of $\mathrm { E } _ { \mathrm { T O T } }$ and $\operatorname { E } _ { \mathrm { { T O T } _ { A V G } . } }$ . Using these equations and the 3-sigma distributions for sensitivity error and voltage offset error, the total error versus sensed current $\mathrm { ( I _ { P } ) }$ for the ACS724LLCTR-20AB is shown in Figure 3. As expected, as one transitions toward zero current, the error in percent transitions toward infinity due to division by zero (refer to Figure 3).
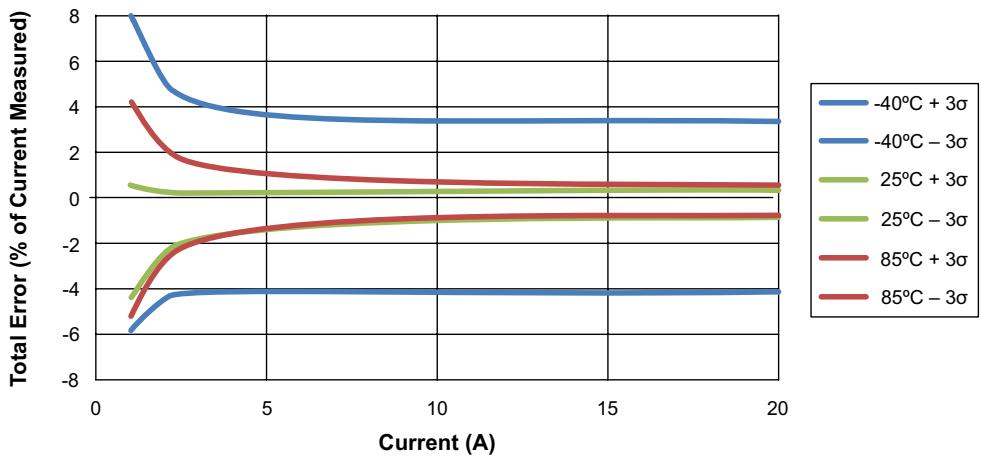
Figure 3: Predicted Total Error as a Function of the Sensed Current for the ACS724LLCTR-20AB
Thermal Rise vs. Primary Current
Self-heating due to the flow of current should be considered during the design of any current sensing system. As current moves through the system, the sensor, printed circuit board (PCB), and contacts to the PCB generate heat.
The thermal response is highly dependent on PCB layout, copper thickness, cooling techniques, and the profile of the injected current. The current profile includes peak current, current “on-time”, and duty cycle. While the data presented in this section was collected with Direct-Current (DC), these numbers may be used to approximate thermal response for both AC signals and current pulses.
The measured rise in steady-state die temperature of the ACS724 versus continuous current at an ambient temperature, $\mathrm { T _ { A } , }$ of 25°C is plotted in Figure 4. The thermal offset curves can be directly applied to other values of $\mathrm { T _ { A } } .$ Conversely, the maximum continuous current at a given $\mathrm { T _ { A } }$ is shown in Figure 5. Surges beyond the maximum current listed in Figure 5 are allowed if the maximum junction temperature, TJ(MAX) (165℃), is not exceeded.
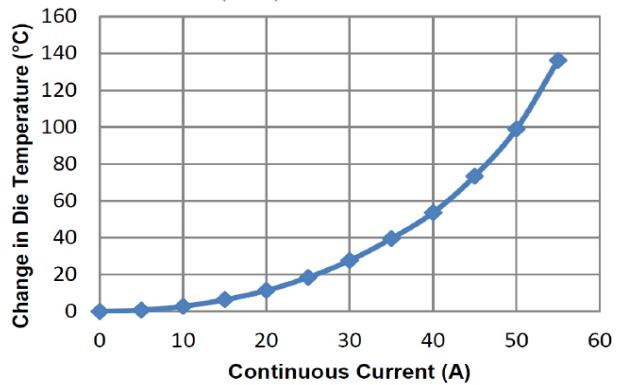
Figure 4: Self-Heating in the LC Package Due to Current Flow
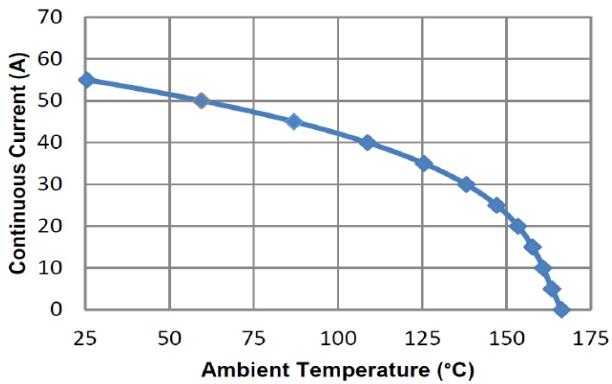
Figure 5: Maximum Continuous Current at a Given $\mathtt { T _ { A } }$
The thermal capacity of the ACS724 should be verified by the end user in the application-specific conditions. The maximum junction temperature, $\mathrm { T } _ { \mathrm { J ( M A X ) } }$ (165℃), should not be exceeded. Further information about this application testing is available in the DC and Transient Current Capability application note on the Allegro website. [1]
ASEK724 Evaluation Board Layout
Thermal data shown in Figure 4 and Figure 5 was collected using the ASEK724 evaluation board (TED-85-0740-003). This board includes 1500 mm2 of 4 oz. copper (0.1388 mm) connected to pins 1 and 2, and to pins 3 and 4, with thermal vias connecting the layers. Top and bottom layers of the PCB are shown in Figure 6.
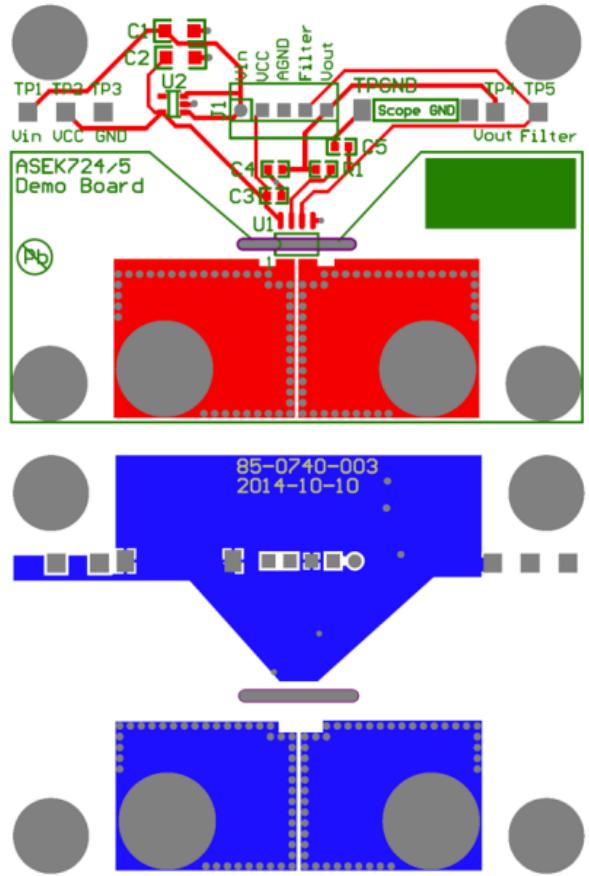
Figure 6: Top and Bottom Layers for ASEK724 Evaluation Board
Gerber files for the ASEK724 evaluation board are available for download from the Allegro website. See the technical documents section of the ACS724 device webpage. [2]
DEFINITIONS OF ACCURACY CHARACTERISTICS
Sensitivity (Sens). The change in sensor IC output in response to a 1A change through the primary conductor. The sensitivity is the product of the magnetic circuit sensitivity (G /A) (1 G = 0.1 mT) and the linear IC amplifier gain (mV/G). The linear IC ampli fier gain is programmed at the factory to optimize the sensitivity (mV/A) for the full-scale current of the device.
Nonlinearity $( \mathbf { E _ { L I N } } ) .$ . The nonlinearity is a measure of how linear the output of the sensor IC is over the full current measurement range. The nonlinearity is calculated as:
$$
E _ {L I N} = \left{1 - \left[ \frac {V _ {I O U T} (I _ {P R (m a x)}) - V _ {I O U T (Q)}}{2 \cdot V _ {I O U T} (I _ {P R (m a x)} / 2) - V _ {I O U T (Q)}} \right] \right} \cdot 1 0 0 (%)
$$
where $\mathrm { V _ { I O U T } ( I _ { P R } ( m a x ) ) }$ is the output of the sensor IC with the maximum measurement current flowing through it, and $\mathrm { V } _ { \mathrm { I O U T } } ( \mathrm { I } _ { \mathrm { P R } } ( \mathrm { m a x } ) / 2 )$ is the output of the sensor IC with half of the maximum measurement current flowing through it.
Zero-Current Output Voltage $( \mathbf { V _ { I O U T ( Q ) } } ) .$ The output of the sensor when the primary current is zero. For a unipolar supply voltage, it nominally remains at $0 . 5 \times \mathrm { V } _ { \mathrm { C C } }$ for a bidirectional device and at $0 . 1 \times \mathrm { V } _ { \mathrm { C C } }$ for a unidirectional device. For example, in the case of a bidirectional output device, $\mathrm { v } _ { \mathrm { C C } } = 5 \mathrm { V }$ translates into $\mathrm { V } _ { \mathrm { I O U T ( Q ) } } = 2 . 5 \mathrm { V } .$ Variation in $\mathrm { V _ { I O U T ( Q ) } }$ can be attributed to the resolution of the Allegro linear IC quiescent voltage trim and thermal drift.
Voltage Offset Error $( \mathbf { V _ { O E } } )$ . The deviation of the device output from its ideal quiescent value of $0 . 5 \times \mathrm { V } _ { \mathrm { C C } }$ (bidirectional) or $0 . 1 \times \mathrm { V } _ { \mathrm { C C } }$ (unidirectional) due to nonmagnetic causes. To convert this voltage to amperes, divide by the device sensitivity, Sens.
Total Output Error $\bf ( E _ { \mathrm { { T o T } } } )$ . The difference between the current measurement from the sensor IC and the actual current $( { \mathrm { I } } _ { \mathrm { P } } ) { \mathrm { : } }$ relative to the actual current. This is equivalent to the difference between the ideal output voltage and the actual output voltage, divided by the ideal sensitivity, relative to the current flowing through the primary conduction path:
$$
E _ {T O T} \left(I _ {P}\right) = \frac {V _ {I O U T _ i d e a l} \left(I _ {P}\right) - V _ {I O U T} \left(I _ {P}\right)}{\text { Sens } _ {\text { ideal }} \left(I _ {P}\right) \cdot I _ {P}} \cdot 1 0 0 (%)
$$
The Total Output Error incorporates all sources of error and is a function of $\mathrm { I _ { P } }$ . At relatively high currents, $\mathrm { E } _ { \mathrm { T O T } }$ is mostly due to sensitivity error; and, at relatively low currents, $\mathrm { E } _ { \mathrm { T O T } }$ is mostly due to voltage offset error $( \mathrm { V _ { O E } } )$ . In fact, at $\mathrm { I } _ { \mathrm { P } } = 0 ;$ ETOT approaches infinity due to the offset. This is illustrated in Figure 7 and Figure 8. Figure 7 shows a distribution of output voltages versus $\mathrm { I _ { P } }$ at $2 5 ^ { \circ } \mathrm { C }$ and across temperature. Figure 8 shows the corresponding $\mathrm { E } _ { \mathrm { T O T } }$ versus $\mathrm { I _ { P } }$
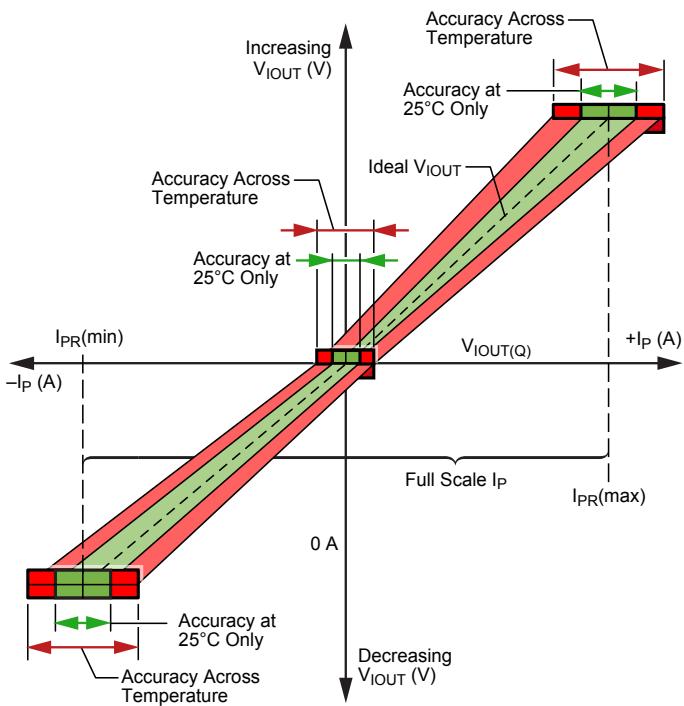
Figure 7: Output Voltage versus Sensed Current
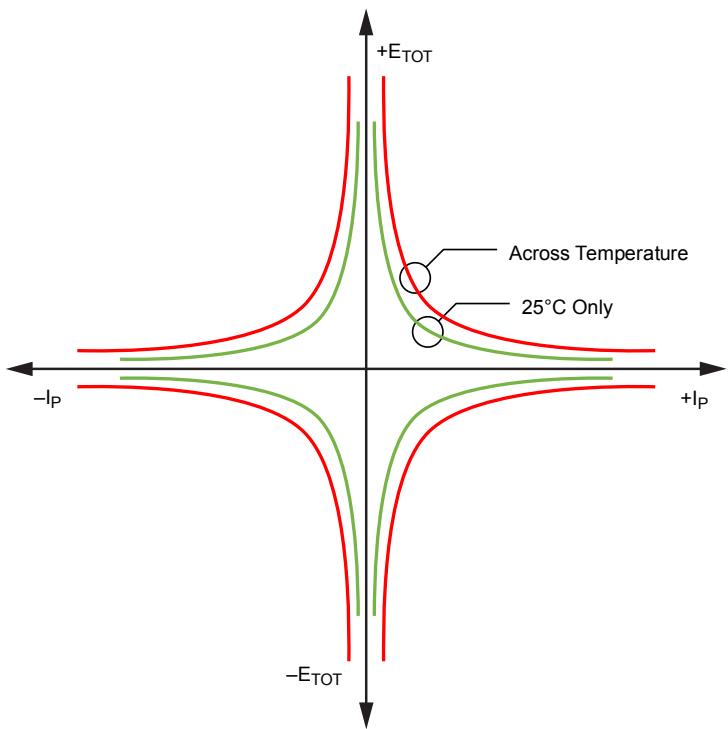
Figure 8: Total Output Error versus Sensed Current
Sensitivity Ratiometry Coefficient (SENS_RAT_COEF). The coefficient defining how the sensitivity scales with $\mathrm { V } _ { \mathrm { C C } } .$ The ideal coefficient is 1, meaning the sensitivity scales proportionally with $\mathrm { V } _ { \mathrm { C C } } . \mathrm { A } 1 0 %$ increase in $\mathrm { v _ { C C } }$ results in a 10% increase in sensitivity. A coefficient of 1.1 means that the sensitivity increases by 10% more than the ideal proportionality case. This means that a 10% increase in $\mathrm { v _ { C C } }$ results in an 11% increase in sensitivity. This relationship is described by the following equation:
$$
\operatorname{Sens} \left(V _ {c c}\right) = \operatorname{Sens} (5 V) \left[ 1 + \frac {\left(V _ {c c} - 5 V\right) \cdot \text { SENS } _ {-} R A T _ {-} C O E F}{5 V} \right]
$$
This can be rearranged to define the sensitivity ratiometry coefficient as:
$$
S E N S _ R A T _ C O E F = \left[ \frac {\text { Sens } (V _ {c c})}{\text { Sens } (5 V)} - 1 \right] \cdot \frac {5 V}{(V _ {c c} - 5 V)}
$$
Zero-Current Output Ratiometry Coefficient (QVO_RAT COEF). The coefficient defining how the zero-current output voltage scales with $\mathrm { V } _ { \mathrm { C C } } .$ The ideal coefficient is 1, meaning the output voltage scales proportionally with $\mathrm { v } _ { \mathrm { C C } } ,$ always being equal to $\mathrm { V } _ { \mathrm { C C } } / 2$ . A coefficient of 1.1 means that the zero-current output voltage increases by 10% more than the ideal proportionality case. This means that a 10% increase in $\mathrm { v } _ { \mathrm { C C } }$ results in an 11% increase in the zero-current output voltage. This relationship is described by the following equation:
$$
V I O U T Q \left(V _ {c c}\right) = V I O U T Q (5 V) \left[ 1 + \frac {\left(V _ {c c} - 5 V\right) \cdot Q V O _ R A T _ C O E F}{5 V} \right]
$$
This can be rearranged to define the zero-current output ratiometry coefficient as:
$$
Q V O _ {-} R A T _ {-} C O E F = \left[ \frac {V I O U T Q (V _ {c c})}{V I O U T Q (5 V)} - 1 \right] \cdot \frac {5 V}{(V _ {c c} - 5 V)}
$$
PACKAGE OUTLINE DRAWING
For Reference Only – Not for Tooling Use (Reference MS-012AA) Dimensions in mil imeters – NOT TO SCALE Dimensions exclusive of mold flash, gate burrs, and dambar protrusions Exact case and lead configuration at supplier discretion within limits shown
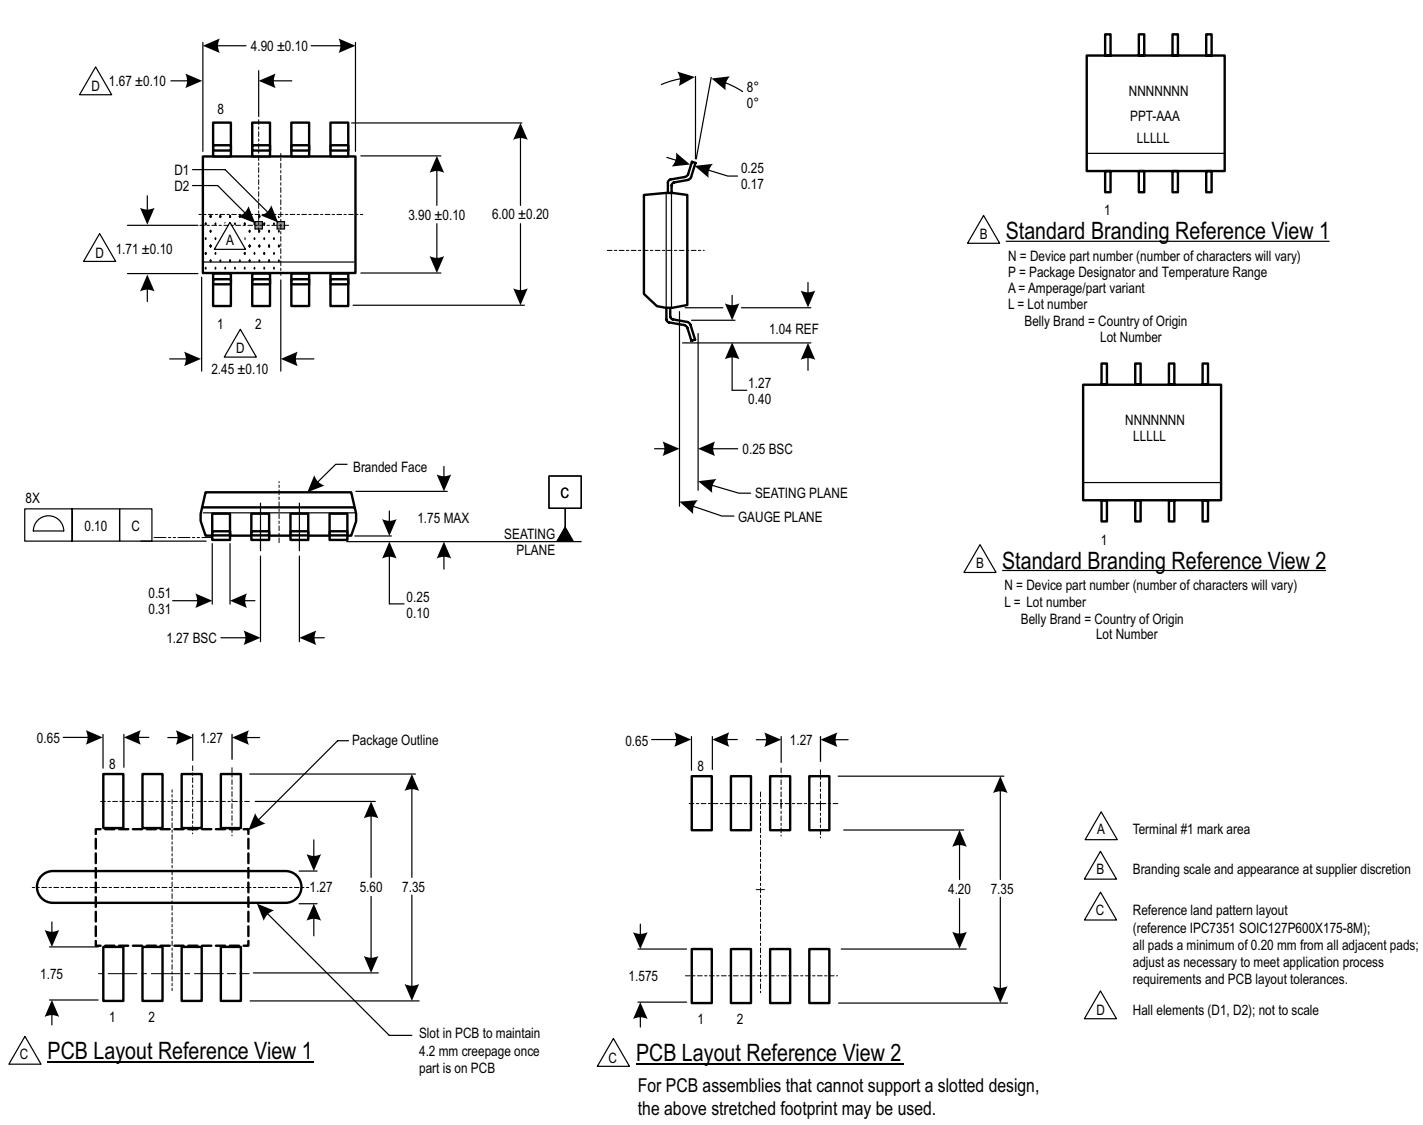
Figure 9: Package LC, 8-pin SOICN
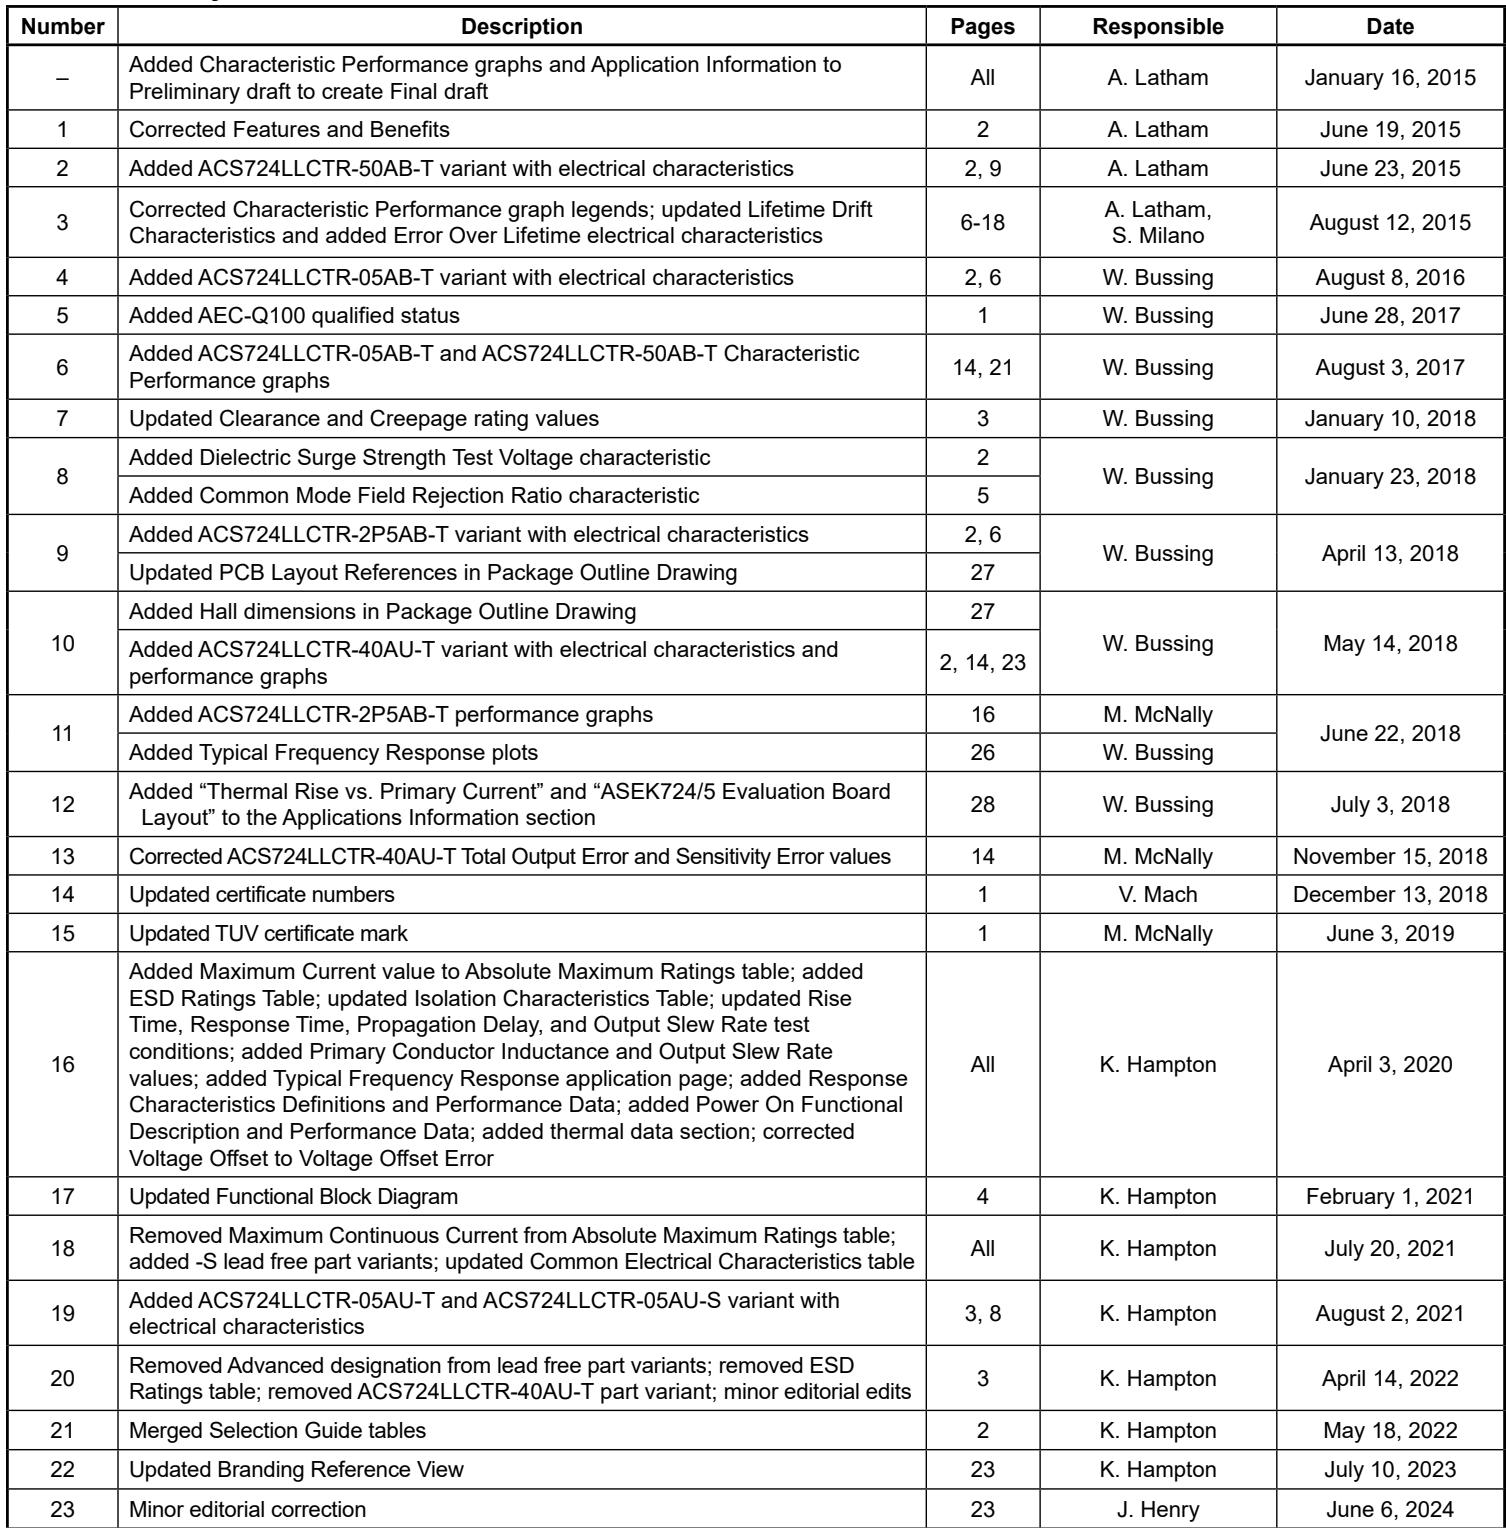
Revision History
| Number | Description | Pages | Responsible | Date |
| - | Added Characteristic Performance graphs and Application Information to Preliminary draft to create Final draft | All | A. Latham | January 16, 2015 |
| 1 | Corrected Features and Benefits | 2 | A. Latham | June 19, 2015 |
| 2 | Added ACS724LLCTR-50AB-T variant with electrical characteristics | 2, 9 | A. Latham | June 23, 2015 |
| 3 | Corrected Characteristic Performance graph legends; updated Lifetime Drift Characteristics and added Error Over Lifetime electrical characteristics | 6-18 | A. Latham,S. Milano | August 12, 2015 |
| 4 | Added ACS724LLCTR-05AB-T variant with electrical characteristics | 2, 6 | W. Bussing | August 8, 2016 |
| 5 | Added AEC-Q100 qualified status | 1 | W. Bussing | June 28, 2017 |
| 6 | Added ACS724LLCTR-05AB-T and ACS724LLCTR-50AB-T Characteristic Performance graphs | 14, 21 | W. Bussing | August 3, 2017 |
| 7 | Updated Clearance and Creepage rating values | 3 | W. Bussing | January 10, 2018 |
| 8 | Added Dielectric Surge Strength Test Voltage characteristic | 2 | W. Bussing | January 23, 2018 |
| Added Common Mode Field Rejection Ratio characteristic | 5 | |||
| 9 | Added ACS724LLCTR-2P5AB-T variant with electrical characteristics | 2, 6 | W. Bussing | April 13, 2018 |
| Updated PCB Layout References in Package Outline Drawing | 27 | |||
| 10 | Added Hall dimensions in Package Outline Drawing | 27 | W. Bussing | May 14, 2018 |
| Added ACS724LLCTR-40AU-T variant with electrical characteristics and performance graphs | 2, 14, 23 | |||
| 11 | Added ACS724LLCTR-2P5AB-T performance graphs | 16 | M. McNally | June 22, 2018 |
| Added Typical Frequency Response plots | 26 | W. Bussing | ||
| 12 | Added “Thermal Rise vs. Primary Current” and “ASEK724/5 Evaluation Board Layout” to the Applications Information section | 28 | W. Bussing | July 3, 2018 |
| 13 | Corrected ACS724LLCTR-40AU-T Total Output Error and Sensitivity Error values | 14 | M. McNally | November 15, 2018 |
| 14 | Updated certificate numbers | 1 | V. Mach | December 13, 2018 |
| 15 | Updated TUV certificate mark | 1 | M. McNally | June 3, 2019 |
| 16 | Added Maximum Current value to Absolute Maximum Ratings table; added ESD Ratings Table; updated Isolation Characteristics Table; updated Rise Time, Response Time, Propagation Delay, and Output Slew Rate test conditions; added Primary Conductor Inductance and Output Slew Rate values; added Typical Frequency Response application page; added Response Characteristics Definitions and Performance Data; added Power On Functional Description and Performance Data; added thermal data section; corrected Voltage Offset to Voltage Offset Error | All | K. Hampton | April 3, 2020 |
| 17 | Updated Functional Block Diagram | 4 | K. Hampton | February 1, 2021 |
| 18 | Removed Maximum Continuous Current from Absolute Maximum Ratings table; added -S lead free part variants; updated Common Electrical Characteristics table | All | K. Hampton | July 20, 2021 |
| 19 | Added ACS724LLCTR-05AU-T and ACS724LLCTR-05AU-S variant with electrical characteristics | 3, 8 | K. Hampton | August 2, 2021 |
| 20 | Removed Advanced designation from lead free part variants; removed ESD Ratings table; removed ACS724LLCTR-40AU-T part variant; minor editorial edits | 3 | K. Hampton | April 14, 2022 |
| 21 | Merged Selection Guide tables | 2 | K. Hampton | May 18, 2022 |
| 22 | Updated Branding Reference View | 23 | K. Hampton | July 10, 2023 |
| 23 | Minor editorial correction | 23 | J. Henry | June 6, 2024 |
Revision History
| Number | Description | Pages | Responsible | Date |
| 24 | Minor editorial corrections throughout | All pages | J. Henry | June 24, 2025 |
| 25 | Added ACS724LLCTR-50AU-S and ACS724LLCTR-50AU-T part variants, added CF = 0 condition to all characteristics, and made minor formatting changes | 2, 5–16, 25, 26 | K. Hampton | March 31, 2026 |
Copyright 2026, Allegro MicroSystems.
Allegro MicroSystems reserves the right to make, from time to time, such departures from the detail specifications as may be required to permit improvements in the performance, reliability, or manufacturability of its products. Before placing an order, the user is cautioned to verify that the information being relied upon is current.
Allegro’s products are not to be used in any devices or systems, including but not limited to life support devices or systems, in which a failure of Allegro’s product can reasonably be expected to cause bodily harm.
The information included herein is believed to be accurate and reliable. However, Allegro MicroSystems assumes no responsibility for its use; nor for any infringement of patents or other rights of third parties which may result from its use.
Copies of this document are considered uncontrolled documents.
Figures and diagrams from the PDF
Preview the extracted datasheet assets and open any image in a separate tab for closer inspection.










Use this datasheet from any agent
Send the page, markdown, chunks, or search endpoint to ChatGPT, Claude, embedr-app, or your own tooling.