
INA238
85V, 16-Bit, High-Precision Power Monitor With I²C Interface
INA238 85V, 16-Bit, High-Precision Power Monitor With I2C Interface
1 Features
• High-resolution, 16-bit delta-sigma ADC
• Current monitoring accuracy:
– Offset voltage: ±5µV (maximum)
– Offset drift: $\pm 0 . 0 2 \mu \mathsf { V } / ^ { \circ } \mathsf { C }$ (maximum)
– Gain error: ±0.1% (maximum)
– Gain error drift: ±25ppm/°C (maximum)
– Common mode rejection: 140dB (minimum)
• Power monitoring accuracy:
– 0.7% full scale, $\ 4 0 ^ { \circ } \mathsf { C }$ to $+ 1 2 5 ^ { \circ } \mathrm { C }$ (maximum)
• Fast alert response: 75μs
• Wide common-mode range: –0.3V to +85V
• Bus voltage sense input: 0V to 85V
• Shunt full-scale differential range: ±163.84mV / ±40.96mV
• Input bias current: 2.5nA (maximum)
• Temperature sensor: ±1°C (maximum at $2 5 ^ { \circ } \mathrm { C } )$
• Programmable conversion time and averaging
• 2.94MHz high-speed I2C interface with 16 pinselectable addresses
• Operates from a 2.7V to 5.5V supply:
– Operational current: 640µA (typical)
– Shutdown current: 5µA (maximum)
2 Applications
• DC/DC converters and power inverters
• Industrial battery packs
• Power-over-ethernet (PoE)
• Telecom equipment
• Enterprise servers
3 Description
The INA238 is an ultra-precise digital power monitor with a 16-bit delta-sigma ADC specifically designed for current-sensing applications. The device can measure a full-scale differential input of ±163.84mV or ±40.96mV across a resistive shunt sense element with common-mode voltage support from –0.3V to +85V.
The INA238 reports current, bus voltage, temperature, and power, all while performing the needed calculations in the background. The integrated temperature sensor is ±1°C accurate for die temperature measurement and is useful in monitoring the system ambient temperature.
The low offset and gain drift design of the INA238 allows the device to be used in precise systems that do not undergo multi-temperature calibration during manufacturing. Further, the very low offset voltage and noise allow for use in A to kA sensing applications and provide a wide dynamic range without significant power dissipation losses on the sensing shunt element. The low input bias current of the device permits the use of larger currentsense resistors, thus providing accurate current measurements in the micro-amp range.
The device allows for selectable ADC conversion times from 50µs to 4.12ms as well as sample averaging from 1x to 1024x, which further helps reduce the noise of the measured data.
Package Information
| PART NUMBER | $PACKAGE^{(1)}$ | $PACKAGE SIZE^{(2)}$ |
| INA238 | DGS (VSSOP, 10) | 3.00mm × 4.90mm |
(1) For more information, see Section 10.
(2) The package size (length × width) is a nominal value and includes pins, where applicable.
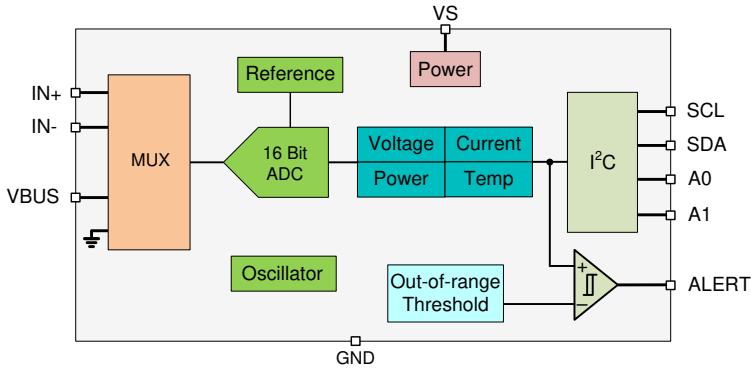
Simplified Block Diagram
Table of Contents
1 Features....1
2 Applications....1
3 Description....1
4 Pin Configuration and Functions....3
5 Specifications....3
5.1 Absolute Maximum Ratings....3
5.2 ESD Ratings....4
5.3 Recommended Operating Conditions....4
5.4 Thermal Information....4
5.5 Electrical Characteristics....5
5.6 Timing Requirements (I2C)....7
5.7 Timing Diagram....7
5.8 Typical Characteristics....8
6 Detailed Description....12
6.1 Overview....12
6.2 Functional Block Diagram....12
6.3 Feature Description....12
6.4 Device Functional Modes....17
6.5 Programming....18
6.6 Register Maps....21
7 Application and Implementation....29
7.1 Application Information....29
7.2 Typical Application....33
7.3 Power Supply Recommendations....36
7.4 Layout....36
8 Device and Documentation Support....38
8.1 Receiving Notification of Documentation Updates....38
8.2 Support Resources....38
8.3 Trademarks....38
8.4 Electrostatic Discharge Caution....38
8.5 Glossary....38
9 Revision History....38
10 Mechanical, Packaging, and Orderable Information....38
4 Pin Configuration and Functions
$$
\begin{array}{c c c} \text {A1} & 1 & 1 0 \ \text {A0} & 2 & 9 \ \text {ALERT} & 3 & 8 \ \text {SDA} & 4 & 7 \ \text {SCL} & 5 & 6 \end{array} \begin{array}{c c c} \text {IN+} \ \text {IN-} \ \text {VBUS} \ \text {GND} \ \text {VS} \end{array}
$$
Figure 4-1. DGS Package 10-Pin VSSOP Top View
Table 4-1. Pin Functions
| PIN | TYPE | DESCRIPTION | |
| NO. | NAME | ||
| 1 | A1 | Digital input | $I^{2}C$ address pin. Connect to GND, SCL, SDA, or VS. |
| 2 | A0 | Digital input | $I^{2}C$ address pin. Connect to GND, SCL, SDA, or VS. |
| 3 | ALERT | Digital output | Open-drain alert output, default state is active low. |
| 4 | SDA | Digital input/output | Open-drain bidirectional $I^{2}C$ data. |
| 5 | SCL | Digital input | $I^{2}C$ clock input. |
| 6 | VS | Power supply | Power supply, 2.7V to 5.5V. |
| 7 | GND | Ground | Ground. |
| 8 | VBUS | Analog input | Bus voltage input. |
| 9 | IN- | Analog input | Negative input to the device. For high-side applications, connect to load side of sense resistor. For low-side applications, connect to ground side of sense resistor. |
| 10 | IN+ | Analog input | Positive input to the device. For high-side applications, connect to power supply side of sense resistor. For low-side applications, connect to load side of sense resistor. |
5 Specifications
5.1 Absolute Maximum Ratings
over operating free-air temperature range (unless otherwise noted)(1)
| MIN | MAX | UNIT | ||
| $V_S$ | Supply voltage | 6 | V | |
| $V_{IN+}, V_{IN-}^{(2)}$ | Differential ( $V_{IN+}$ ) - ( $V_{IN-}$ ) | -40 | 40 | V |
| Common-mode | -0.3 | 85 | V | |
| $V_{VBUS}$ | -0.3 | 85 | V | |
| $V_{ALERT}$ | ALERT | -0.3 | $V_S + 0.3$ | V |
| $V_{IO}$ | SDA, SCL | -0.3 | 6 | V |
| $I_{IN}$ | Input current into any pin | 5 | mA | |
| $I_{OUT}$ | Digital output current | 10 | mA | |
| $T_J$ | Junction temperature | 150 | °C | |
| $T_{stg}$ | Storage temperature | -65 | 150 | °C |
(1) Operation outside the Absolute Maximum Ratings may cause permanent device damage. Absolute Maximum Ratings do not imply functional operation of the device at these or any other conditions beyond those listed under Recommended Operating Conditions. If used outside the Recommended Operating Conditions but within the Absolute Maximum Ratings, the device may not be fully functional, and this may affect device reliability, functionality, performance, and shorten the device lifetime.
(2) VIN+ and VIN– are the voltages at the IN+ and IN– pins, respectively.
5.2 ESD Ratings
| VALUE | UNIT | |||
| $V_{(ESD)}$ | Electrostatic discharge | Human body model (HBM), per ANSI/ESDA/JEDEC JS-001, all pins(1) | ±2000 | V |
| Charged device model (CDM), per JEDEC specification JESD22-C101, all pins(2) | ±1000 | |||
(1) JEDEC document JEP155 states that 500-V HBM allows safe manufacturing with a standard ESD control process.
(2) JEDEC document JEP157 states that 250-V CDM allows safe manufacturing with a standard ESD control process.
5.3 Recommended Operating Conditions
over operating free-air temperature range (unless otherwise noted)
| MIN | NOM | MAX | UNIT | ||
| $V_{CM}$ | Common-mode input range | -0.3 | 85 | V | |
| $V_S$ | Operating supply range | 2.7 | 5.5 | V | |
| $T_A$ | Ambient temperature | -40 | 125 | °C | |
5.4 Thermal Information
| THERMAL METRIC(1) | INA238 | UNIT | |
| DGS | |||
| 10 PINS | |||
| $R_{\theta JA}$ | Junction-to-ambient thermal resistance | 177.6 | °C/W |
| $R_{\theta JC(top)}$ | Junction-to-case (top) thermal resistance | 66.4 | °C/W |
| $R_{\theta JB}$ | Junction-to-board thermal resistance | 99.5 | °C/W |
| $\Psi_{JT}$ | Junction-to-top characterization parameter | 9.7 | °C/W |
| $Y_{JB}$ | Junction-to-board characterization parameter | 97.6 | °C/W |
| $R_{\theta JC(bot)}$ | Junction-to-case (bottom) thermal resistance | N/A | °C/W |
(1) For more information about traditional and new thermal metrics, see the Semiconductor and IC Package Thermal Metrics application note.
5.5 Electrical Characteristics
at $\mathsf { T } _ { \mathsf { A } } = 2 5 \ \mathsf { ^ { o } C } , \mathsf { V } _ { \mathsf { S } } = 3 . 3 \mathsf { V } , \mathsf { V } _ { \mathsf { S E N S E } } = \mathsf { V } _ { \mathsf { I N } + } - \mathsf { V } _ { \mathsf { I N } - } = 0 \mathsf { V } , \mathsf { V } _ { \mathsf { C M } } = \mathsf { V } _ { \mathsf { I N } - } = 4 8 \mathsf { V } .$ (unless otherwise noted)
| PARAMETER | TEST CONDITIONS | MIN | TYP | MAX | UNIT | |
| INPUT | ||||||
| $V_{CM}$ | Common-mode input range | $T_A=-40°C to +125°C$ | -0.3 | 85 | V | |
| $V_{VBUS}$ | Bus voltage input range | 0 | 85 | V | ||
| CMRR | Common-mode rejection | $-0.3V < V_{CM} < 85V, T_A=-40°C to +125°C$ | 140 | 160 | dB | |
| $V_{DIFF}$ | Shunt voltage input range | $T_A=-40°C to +125°C, ADCRANGE=0$ | -163.84 | 163.84 | mV | |
| $T_A=-40°C to +125°C, ADCRANGE=1$ | -40.96 | 40.96 | mV | |||
| $V_{os}$ | Shunt offset voltage | $V_{CM}=48V$ | ±1.5 | ±5 | μV | |
| $V_{CM}=0V$ | ±1.5 | ±5 | μV | |||
| $dV_{os}/dT$ | Shunt offset voltage drift | $T_A=-40°C to +125°C$ | ±2 | ±20 | nV/°C | |
| PSRR | Shunt offset voltage vs power supply | $V_S=2.7V to 5.5V, T_A=-40°C to +125°C$ | ±0.1 | ±1 | μV/V | |
| $V_{os\_bus}$ | $V_{BUS}$ offset voltage | $V_{BUS}=20mV$ | ±1 | ±5 | mV | |
| $dV_{os}/dT$ | $V_{BUS}$ offset voltage drift | $T_A=-40°C to +125°C$ | ±4 | ±40 | μV/°C | |
| PSRR | $V_{BUS}$ offset voltage vs power supply | $V_S=2.7V to 5.5V$ | ±1.1 | mV/V | ||
| $I_B$ | Input bias current | Either input, IN+ or IN-, $V_{CM}=85V$ | 0.1 | 2.5 | nA | |
| $Z_{VBUS}$ | VBUS pin input impedance | Active mode | 0.8 | 1 | 1.2 | MΩ |
| $I_{VBUS}$ | VBUS pin leakage current | Shutdown mode, $V_{BUS}=85V$ | 10 | nA | ||
| $R_{DIFF}$ | Input differential impedance | Active mode, $V_{IN+}-V_{IN-}<164mV$ | 92 | kΩ | ||
| DC ACCURACY | ||||||
| $G_{SERR}$ | Shunt voltage gain error | ±0.01 | ±0.1 | % | ||
| $G_{S\_DRFT}$ | Shunt voltage gain error drift | ±25 | ppm/°C | |||
| $G_{BERR}$ | $V_{BUS}$ voltage gain error | ±0.01 | ±0.1 | % | ||
| $G_{B\_DRFT}$ | $V_{BUS}$ voltage gain error drift | ±25 | ppm/°C | |||
| $P_{TME}$ | Power total measurement error (TME) | $T_A=-40°C to +125°C, at full scale$ | ±0.7 | % | ||
| ADC resolution | 16 | Bits | ||||
| 1 LSB step size | Shunt voltage, ADCRANGE=0 | 5 | μV | |||
| Shunt voltage, ADCRANGE=1 | 1.25 | μV | ||||
| Bus voltage | 3.125 | mV | ||||
| Temperature | 125 | m°C | ||||
| $T_{CT}$ | ADC conversion-time(1) | Conversion time field = 0h | 50 | μs | ||
| Conversion time field = 1h | 84 | |||||
| Conversion time field = 2h | 150 | |||||
| Conversion time field = 3h | 280 | |||||
| Conversion time field = 4h | 540 | |||||
| Conversion time field = 5h | 1052 | |||||
| Conversion time field = 6h | 2074 | |||||
| Conversion time field = 7h | 4120 | |||||
| INL | Integral Non-Linearity | ±2 | m% | |||
| DNL | Differential Non-Linearity | 0.2 | LSB | |||
| CLOCK SOURCE | ||||||
| $F_{OSC}$ | Internal oscillator frequency | 1 | MHz | |||
| $F_{OSC\_TOL}$ | Internal oscillator frequency tolerance | $T_A=25°C$ | ±0.5 | % | ||
| $T_A=-40°C to +125°C$ | ±1 | % | ||||
| TEMPERATURE SENSOR | ||||||
| Measurement range | -40 | +125 | °C | |||
| Temperature accuracy | $T_A=25°C$ | ±0.15 | ±1 | °C | ||
| $T_A=-40°C to +125°C$ | ±0.2 | ±2 | °C | |||
| POWER SUPPLY | ||||||
| $V_S$ | Supply voltage | 2.7 | 5.5 | V | ||
| $I_Q$ | Quiescent current | $V_{SENSE}=0V$ | 640 | 750 | μA | |
| $V_{SENSE}=0V, T_A=-40°C to +125°C$ | 1.1 | mA | ||||
| $I_{QSD}$ | Quiescent current, shutdown | Shutdown mode | 2.8 | 5 | μA | |
| $T_{POR}$ | Device start-up time | Power-up (NPOR) | 300 | μs | ||
| From shutdown mode | 60 | |||||
| DIGITAL INPUT / OUTPUT | ||||||
| $V_{IH}$ | Logic input level, high | SDA, SCL | 1.2 | 5.5 | V | |
| $V_{IL}$ | Logic input level, low | GND | 0.4 | V | ||
| $V_{OL}$ | Logic output level, low | $I_{OL}=3mA$ | GND | 0.4 | V | |
| $I_{IO\_LEAK}$ | Digital leakage input current | $0≤ V_{IN}≤ V_{S}$ | -1 | 1 | μA | |
(1) Subject to oscillator accuracy and drift
5.6 Timing Requirements (I2C)
| MIN | NOM | MAX | UNIT | ||
| $I^{2}C$ BUS (FAST MODE) | |||||
| $F_{(SCL)}$ | $I^{2}C$ clock frequency | 1 | 400 | kHz | |
| $t_{(BUF)}$ | Bus free time between STOP and START conditions | 600 | ns | ||
| $t_{(HDSTA)}$ | Hold time after a repeated START condition. After this period, the first clock is generated. | 100 | ns | ||
| $t_{(SUSTA)}$ | Repeated START condition setup time | 100 | ns | ||
| $t_{(SUSTO)}$ | STOP condition setup time | 100 | ns | ||
| $t_{(HDDAT)}$ | Data hold time | 10 | 900 | ns | |
| $t_{(SUDAT)}$ | Data setup time | 100 | ns | ||
| $t_{(LOW)}$ | SCL clock low period | 1300 | ns | ||
| $t_{(HIGH)}$ | SCL clock high period | 600 | ns | ||
| $t_F$ | Data fall time | 300 | ns | ||
| $t_F$ | Clock fall time | 300 | ns | ||
| $t_R$ | Clock rise time | 300 | ns | ||
| $I^{2}C$ BUS (HIGH-SPEED MODE) | |||||
| $F_{(SCL)}$ | $I^{2}C$ clock frequency | 10 | 2940 | kHz | |
| $t_{(BUF)}$ | Bus free time between STOP and START conditions | 160 | ns | ||
| $t_{(HDSTA)}$ | Hold time after a repeated START condition. After this period, the first clock is generated. | 100 | ns | ||
| $t_{(SUSTA)}$ | Repeated START condition setup time | 100 | ns | ||
| $t_{(SUSTO)}$ | STOP condition setup time | 100 | ns | ||
| $t_{(HDDAT)}$ | Data hold time | 10 | 125 | ns | |
| $t_{(SUDAT)}$ | Data setup time | 20 | ns | ||
| $t_{(LOW)}$ | SCL clock low period | 200 | ns | ||
| $t_{(HIGH)}$ | SCL clock high period | 60 | ns | ||
| $t_F$ | Data fall time | 80 | ns | ||
| $t_F$ | Clock fall time | 40 | ns | ||
| $t_R$ | Clock rise time | 40 | ns | ||
5.7 Timing Diagram
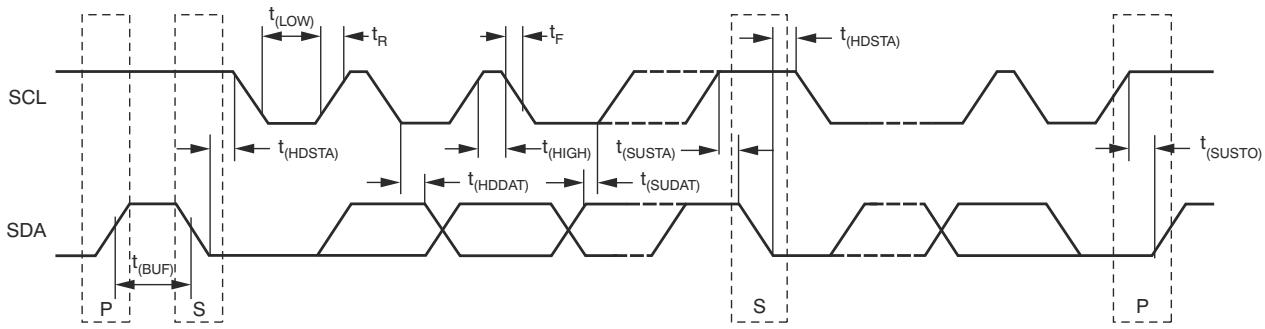
Figure 5-1. I2C Timing Diagram
5.8 Typical Characteristics
at $\mathsf { T } _ { \mathsf { A } } = 2 5 ^ { \circ } \mathsf { C }$ , VVS = 3.3 V, VCM = 48 V, $\mathsf { V } _ { \mathsf { S E N S E } } = 0$ and $V _ { \mathsf { V B U S } } = 4 8 ^ { \circ }$ V (unless otherwise noted)

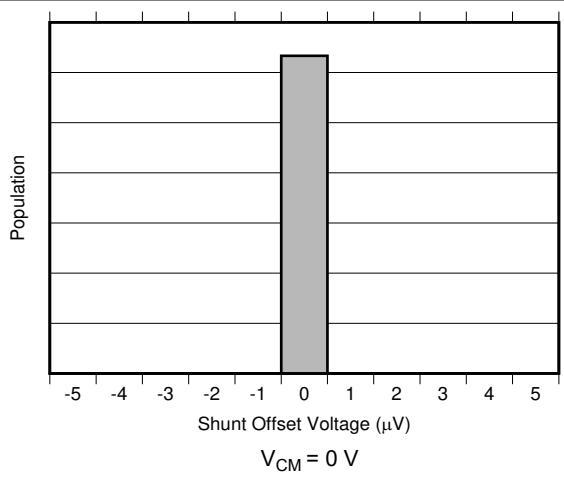
Figure 5-2. Shunt Input Offset Voltage Production Distribution
Figure 5-3. Shunt Input Offset Voltage Production Distribution
Figure 5-4. Shunt Input Offset Voltage vs Temperature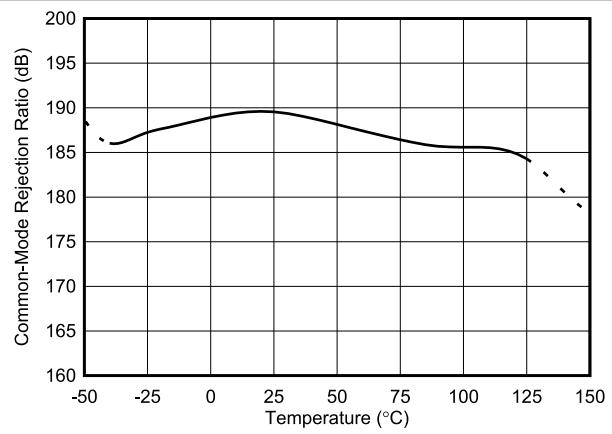
Figure 5-6. Shunt Input Common-Mode Rejection Ratio vs Temperature
Figure 5-5. Common-Mode Rejection Ratio Production Distribution
Figure 5-7. Shunt Input Gain Error Production Distribution
5.8 Typical Characteristics (continued)
at $\mathsf { T } _ { \mathsf { A } } = 2 5 ^ { \circ } \mathsf { C }$ , VVS = 3.3 V, VCM = 48 V, $\mathsf { V } _ { \mathsf { S E N S E } } = 0$ and $V _ { \mathsf { V B U S } } = 4 8 ~ \mathsf { V }$ (unless otherwise noted)
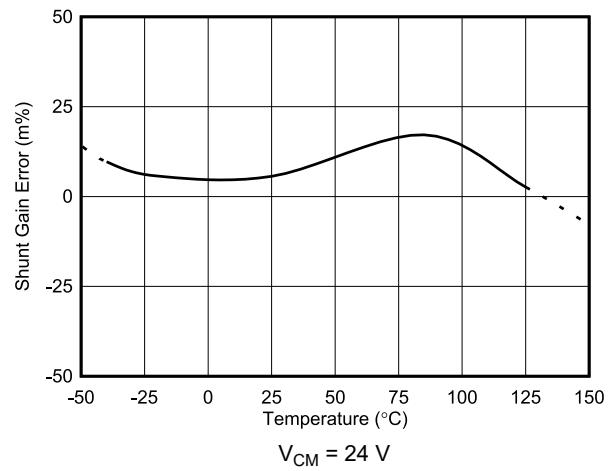
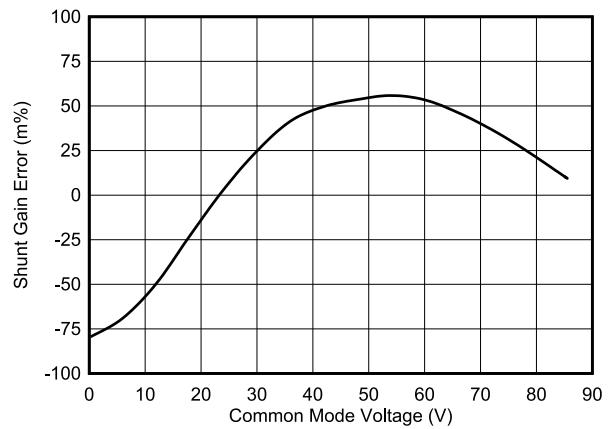
Figure 5-8. Shunt Input Gain Error vs Temperature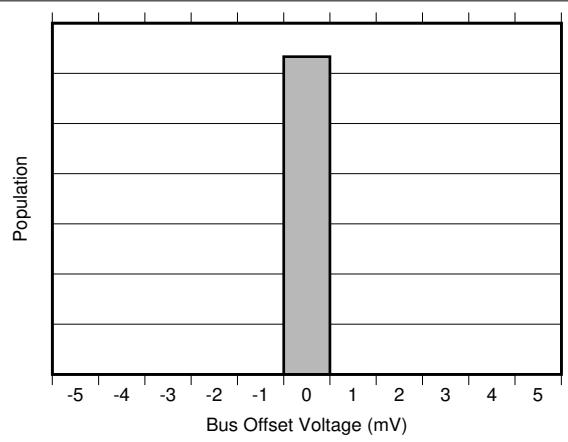
$$
V _ {V B U S} = 2 0 \mathrm{mV}
$$
Figure 5-9. Shunt Input Gain Error vs Common-Mode Voltage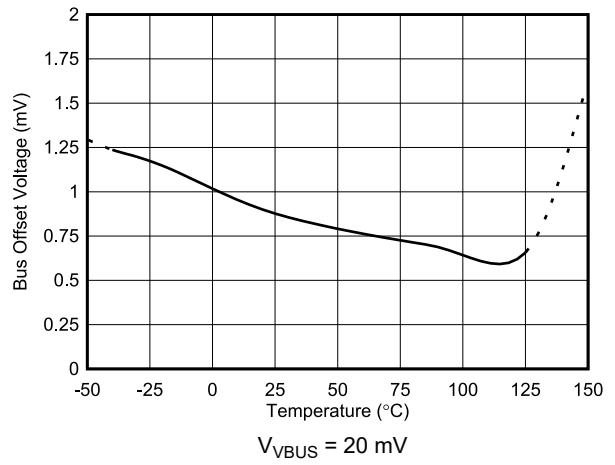
Figure 5-10. Bus Input Offset Voltage Production Distribution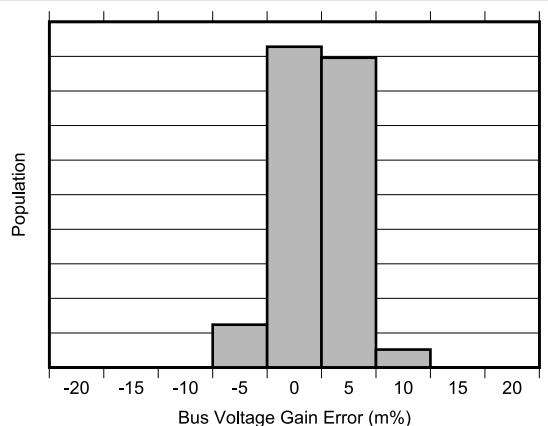
Figure 5-12. Bus Input Gain Error Production Distribution
Figure 5-11. Bus Input Offset Voltage vs Temperature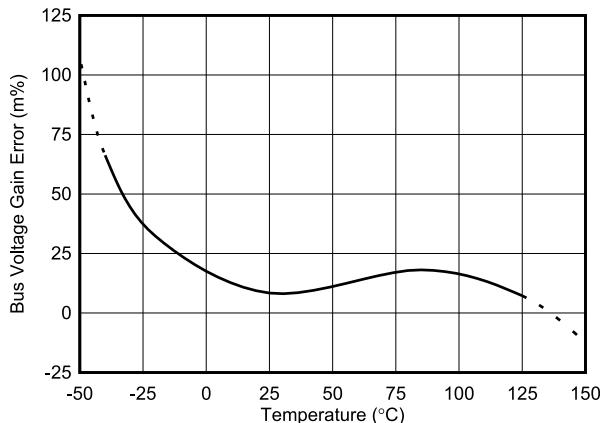
Figure 5-13. Bus Input Gain Error vs Temperature
5.8 Typical Characteristics (continued)
at TA = 25 °C, VVS = 3.3 V, VCM = 48 V, $\mathsf { V } _ { \mathsf { S E N S E } } = 0$ and $V _ { \mathsf { V B U S } } = 4 8 ~ \backslash$ V (unless otherwise noted)
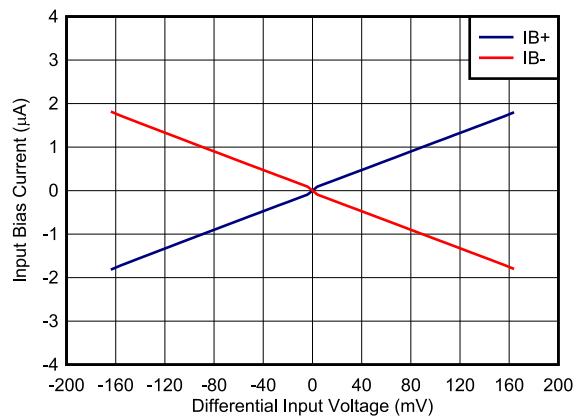
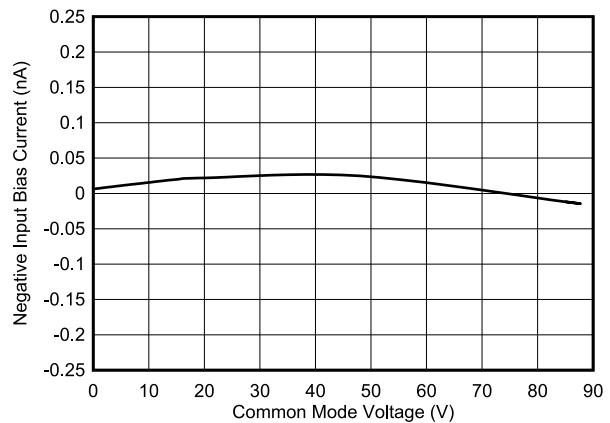
Figure 5-14. Input Bias Current vs Differential Input Voltage
Figure 5-15. Input Bias Current (IB+ or IB–) vs Common-Mode Voltage
Figure 5-16. Input Bias Current vs Temperature
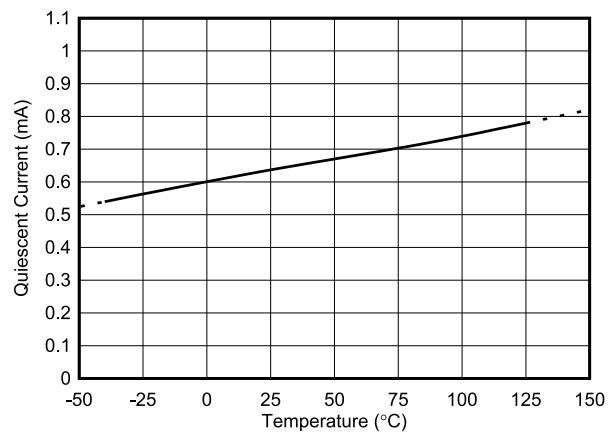
Figure 5-18. Active IQ vs Temperature
Figure 5-17. Input Bias Current vs Temperature, Shutdown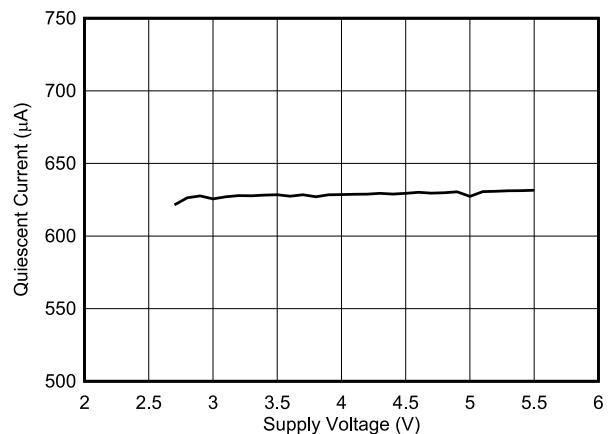
Figure 5-19. Active IQ vs Supply Voltage
5.8 Typical Characteristics (continued)
at $\mathsf { T } _ { \mathsf { A } } = 2 5 \ \mathsf { ^ { o } C } , \mathsf { V } _ { \mathsf { V S } } = 3 . 3 \ \mathsf { V } , \mathsf { V } _ { \mathsf { C M } } = 4 8 \ \mathsf { V } , \mathsf { V } _ { \mathsf { S E N S E } } = 0 , \mathsf { a n d V } _ { \mathsf { V B U S } } = 4 8 \ \mathsf { V } , \mathsf { V } _ { \mathsf { C M S E } } = 5 . 3 \ \mathsf { V } .$ (unless otherwise noted)
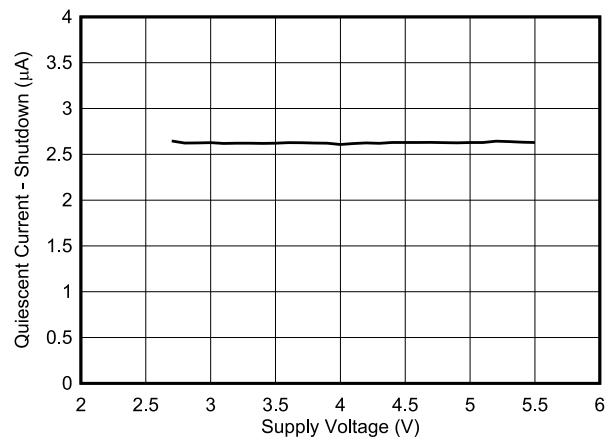
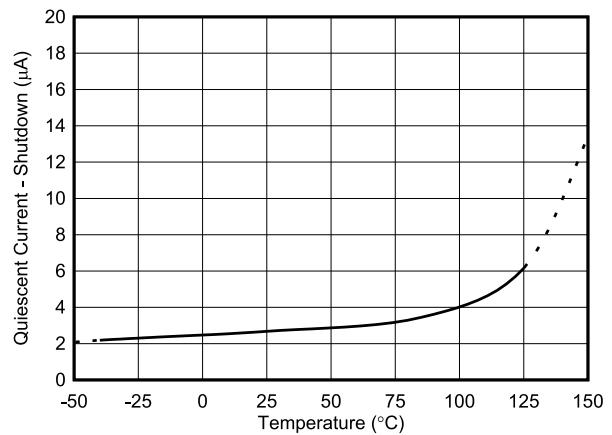
Figure 5-20. Shutdown IQ vs Supply Voltage
Figure 5-21. Shutdown IQ vs Temperature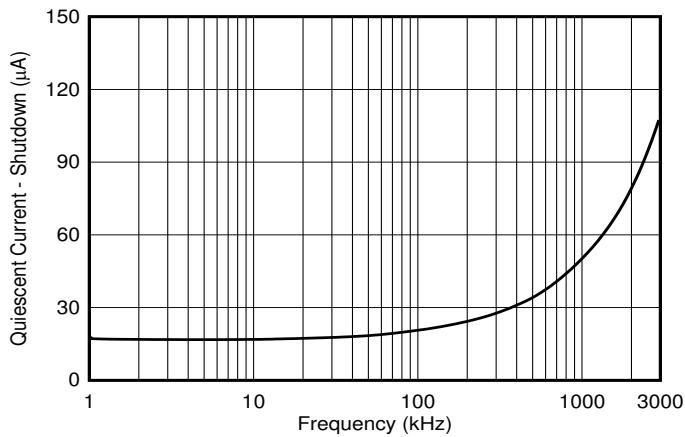
Figure 5-22. Active IQ vs Clock Frequency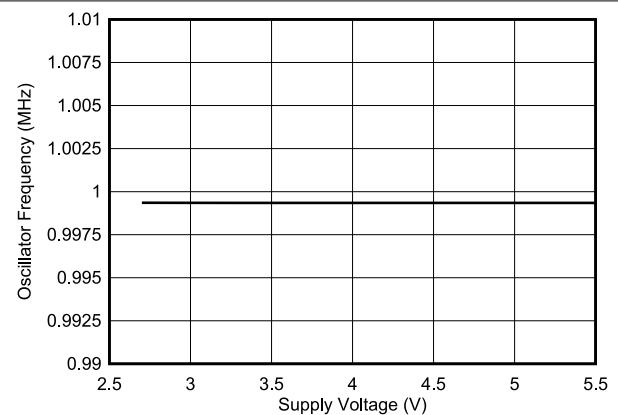
Figure 5-24. Internal Clock Frequency vs Power Supply
Figure 5-23. Shutdown IQ vs Clock Frequency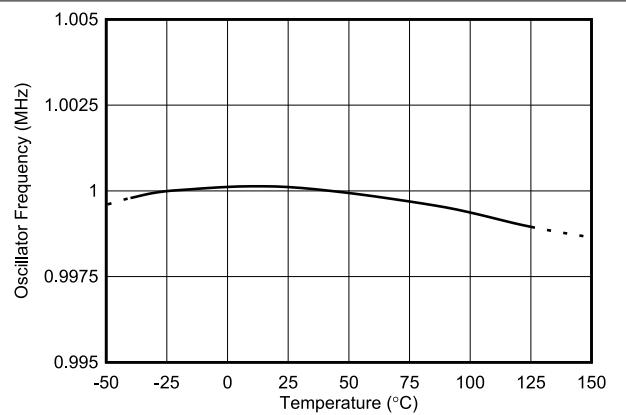
Figure 5-25. Internal Clock Frequency vs Temperature
6 Detailed Description
6.1 Overview
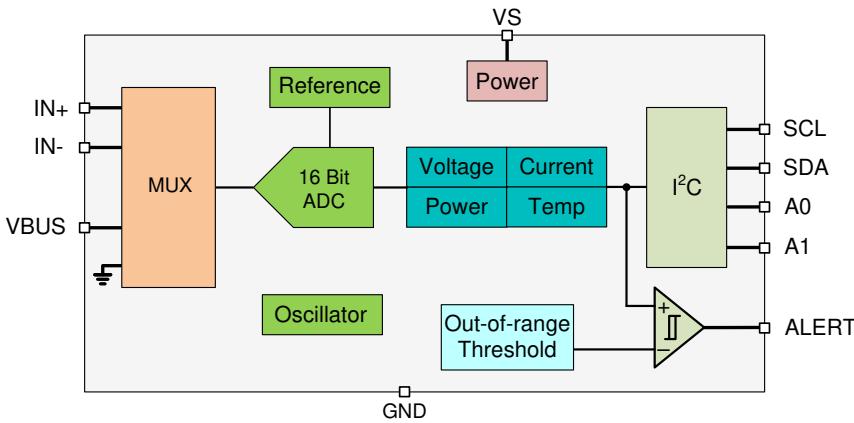
The INA238 device is a digital current sense amplifier with an ${ \mathsf { I } } ^ { 2 } { \mathsf { C } }$ digital interface. The device measures shunt voltage, bus voltage and internal temperature while calculating current, power necessary for accurate decision making in precisely controlled systems. Programmable registers allow flexible configuration for measurement precision as well as continuous or triggered operation. Detailed register information is found in Section 6.6.
6.2 Functional Block Diagram
6.3 Feature Description
6.3.1 Versatile High Voltage Measurement Capability
The INA238 operates off a 2.7 V to 5.5 V supply but can measure voltage and current on rails as high as 85 V. The current is measured by sensing the voltage drop across a external shunt resistor at the IN+ and IN– pins. The input stage of the INA238 is designed such that the input common-mode voltage can be higher than the device supply voltage, V . The supported common-mode voltage range at the input pins is –0.3 V to +85 V, which makes the device well suited for both high-side and low-side current measurements. There are no special considerations for power-supply sequencing because the common-mode input range and device supply voltage are independent of each other; therefore, the bus voltage can be present with the supply voltage off, and vice-versa without damaging the device.
The device also measures the bus supply voltage through the $\mathsf { V } _ { \mathsf { B U S } }$ pin and temperature through the integrated temperature sensor. The differential shunt voltage is measured between the IN+ and IN– pins, while the bus voltage is measured with respect to device ground. Monitored bus voltages can range from 0 V to 85 V, while monitored temperatures can range from ${ } _ { - 4 0 } \circ _ { \mathsf { C } }$ to $+ 1 2 5 ^ { \circ } \mathsf C$
Shunt voltage, bus voltage, and temperature measurements are multiplexed internally to a single ADC as shown in Figure 6-1.
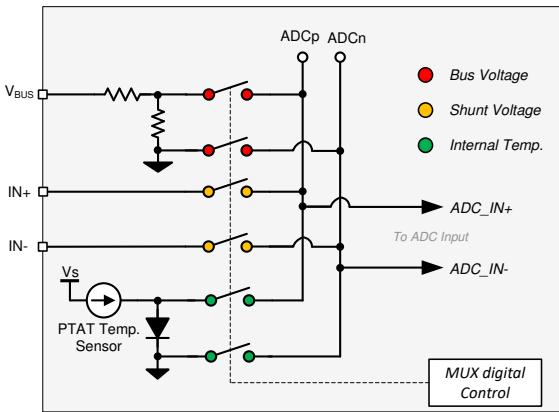
Figure 6-1. High-Voltage Input Multiplexer
6.3.2 Power Calculation
The current and power are calculated after a shunt voltage and bus voltage measurement as shown in Figure 6-2. Power is calculated based on the previous current calculation and the latest bus voltage measurement. If the value loaded into the SHUNT_CAL register is zero, the power value reported is also zero. The current and power values are considered intermediate results (unless the averaging is set to 1) and are stored in an internal accumulation register. Following every measured sample, the newly-calculated values for current and power are appended to this accumulation register until all of the samples have been measured and averaged. After all of the samples have been measured and the corresponding current and power calculations have been made, the accumulated average for each of these parameters is then loaded to the corresponding output registers where they can then be read. These calculations are performed in the background and do not add to the overall conversion time.

Figure 6-2. Power Calculation Scheme
6.3.3 Low Bias Current
The INA238 features very low input bias current which provides several benefits. The low input bias current of the INA238 reduces the current consumed by the device in both active and shutdown state. Another benefit of low bias current is the ability to use input filters to reject high-frequency noise before the signal is converted to digital data. In traditional digital current-sense amplifiers, the addition of input filters comes at the cost of reduced accuracy. However, as a result of the low bias current, the reduction in accuracy due to input filters is minimized. An additional benefit of low bias current is the ability to use a larger shunt resistor to accurately sense smaller currents. Use of a larger value for the shunt resistor allows the device to accurately monitor currents in the sub-mA range.
The bias current in the INA238 is the smallest when the sensed current is zero. As the current starts to increase, the differential voltage drop across the shunt resistor increases which results in an increase in the bias current as shown in Figure 5-14.
6.3.4 High-Precision Delta-Sigma ADC
The integrated ADC is a high-performance, low-offset, low-drift, delta-sigma ADC designed to support bidirectional current flow at the shunt voltage measurement channel. The measured inputs are selected through the high-voltage input multiplexer to the ADC inputs as shown in Figure 6-1. The ADC architecture enables lower drift measurement across temperature and consistent offset measurements across the common-mode voltage, temperature, and power supply variations. A low-offset ADC is preferred in current sensing applications to provide a near 0-V offset voltage that maximizes the useful dynamic range of the system.
The INA238 can measure the shunt voltage, bus voltage, and die temperature, or a combination of any based on the selected MODE bits setting in the ADC_CONFIG register. This permits selecting modes to convert only the shunt voltage or bus voltage to further allow the user to configure the monitoring function to fit the specific application requirements. When no averaging is selected, once an ADC conversion is completed, the converted values are independently updated in the corresponding registers where they can be read through the digital interface at the time of conversion end. The conversion time for shunt voltage, bus voltage, and temperature inputs are set independently from 50 µs to 4.12ms depending on the values programmed in the ADC_CONFIG register. Enabled measurement inputs are converted sequentially so the total time to convert all inputs depends on the conversion time for each input and the number of inputs enabled. When averaging is used, the intermediate values are subsequently stored in an averaging accumulator, and the conversion sequence repeats until the number of averages is reached. After all of the averaging has been completed, the final values are updated in the corresponding registers that can then be read. These values remain in the data output registers until they are replaced by the next fully completed conversion results. In this case, reading the data output registers does not affect a conversion in progress.
The ADC has two conversion modes—continuous and triggered—set by the MODE bits in ADC_CONFIG register. In continuous-conversion mode, the ADC continuously converts the input measurements and update the output registers as described above in an indefinite loop. In triggered-conversion mode, the ADC converts the input measurements as described above, after which the ADC goes into shutdown mode until another single-shot trigger is generated by writing to the MODE bits. Writing the MODE bits interrupts and restart triggered or continuous conversions that are in progress. Although the device can be read at any time, and the data from the last conversion remains available, the Conversion Ready flag (CNVRF bit in DIAG_ALRT register) is provided to help coordinate triggered conversions. This bit is set after all conversions and averaging is completed.
The Conversion Ready flag (CNVRF) clears under these conditions:
• Writing to the ADC_CONFIG register (except for selecting shutdown mode); or
• Reading the DIAG_ALRT Register
While the INA238 device is used in either one of the conversion modes, a dedicated digital engine is calculating the current and power values in the background as described in Section 6.3.2. All of the calculations are performed in the background and do not contribute to conversion time.
For applications that must synchronize with other components in the system, the INA238 conversion can be delayed by programming the CONVDLY bits in CONFIG register in the range between 0 (no delay) and 510 ms. The resolution in programming the conversion delay is 2 ms. The conversion delay is set to 0 by default. Conversion delay can assist in measurement synchronization when multiple external devices are used for voltage or current monitoring purposes. In applications where an time aligned voltage and current measurements are needed, two devices can be used with the current measurement delayed such that the external voltage and current measurements occurs at approximately the same time. Keep in mind that even though the internal time base for the ADC is precise, synchronization is lost over time due to internal and external time base mismatch.
6.3.4.1 Low Latency Digital Filter
The device integrates a low-pass digital filter that performs both decimation and filtering on the ADC output data, which helps with noise reduction. The digital filter is automatically adjusted for the different output data rates and always settles within one conversion cycle. The user has the flexibility to choose different output conversion time periods ${ \sf T } _ { \mathsf { C T } }$ from 50 µs to 4.12 ms. With this configuration the first amplitude notch appears at a frequency which is determined by the selected conversion time period and defined as $\mathsf { f } _ { \mathsf { N O T C H } } \equiv 1 / \mathsf { T } _ { \mathsf { C T } }$ . This means that the filter cut-off frequency scales proportionally with the data output rate as described. Figure 6-3 shows the filter response when the 1.052 ms conversion time period is selected.
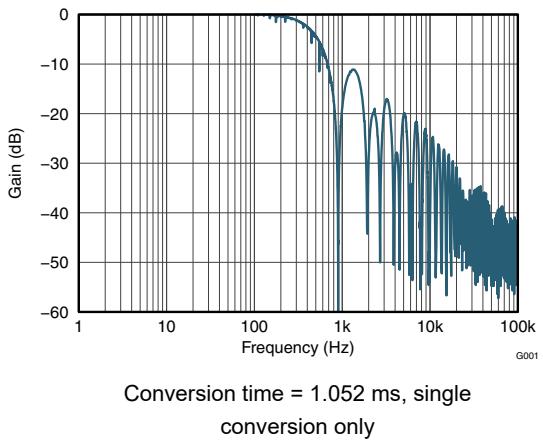
Figure 6-3. ADC Frequency Response
6.3.4.2 Flexible Conversion Times and Averaging
ADC conversion times for shunt voltage, bus voltage and temperature can be set independently from 50 μs to 4.12 ms. The flexibility in conversion time allows for robust operation in a variety of noisy environments. The device also allows for programmable averaging times from a single conversion all the way to an average of 1024 conversions. The amount of averaging selected applies uniformly to all active measurement inputs. The ADC_CONFIG register shown in Table 6-6 provides additional details on the supported conversion times and averaging modes. The INA238 effective resolution of the ADC can be increased by increasing the conversion time and increasing the number of averages. Figure 6-4 and Figure 6-5 shown below illustrate the effect of conversion time and averaging on a constant input signal.
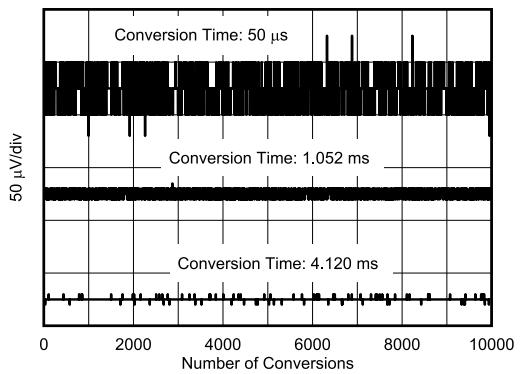
Figure 6-4. Noise vs. Conversion Time (Averaging = 1)

Figure 6-5. Noise vs. Conversion Time (Averaging = 128)
Settings for the conversion time and number of conversions averaged impact the effective measurement resolution. For more detailed information on how averaging reduces noise and increases the effective number of bits (ENOB) see Section 7.1.3
6.3.5 Integrated Precision Oscillator
The internal timebase of the device is provided by an internal oscillator that is trimmed to less than 0.5% tolerance at room temperature. The precision oscillator is the timing source for ADC conversions. The digital filter response varies with conversion time; therefore, the precise clock verifies that the filter response and notch frequency consistency across temperature. On power up, the internal oscillator and ADC take roughly 300 µs to reach <1% error stability. Once the clock stabilizes, the ADC data output is accurate to the electrical specifications provided in Section 5.
6.3.6 Multi-Alert Monitoring and Fault Detection
The INA238 includes a multipurpose, open-drain ALERT output pin that can be used to report multiple diagnostics or as an indicator that the ADC conversion is complete when the device is operating in both triggered and continuous conversion mode. The diagnostics listed in Table 6-1 are constantly monitored and can be reported through the ALERT pin whenever the monitored output value crosses the associated out-of-range threshold.
Table 6-1. ALERT Diagnostics Description
| INA238 DIAGNOSTIC | STATUS BIT IN DIAG_ALRT REGISTER (RO) | OUT-OF-RANGE THRESHOLD REGISTER (R/W) | REGISTER DEFAULT VALUE |
| Shunt Under Voltage Limit | SHNTUL | SUVL | 0x8000 h(two's complement) |
| Shunt Over Voltage Limit | SHNTOL | SOVL | 0x7FFF h(two's complement) |
| Bus Voltage Over-Limit | BUSOL | BOVL | 0x7FFF h(two's complement, positive values only) |
| Bus Voltage Under-Limit | BUSUL | BUVL | 0x0000 h(two's complement, positive values only) |
| Temperature Over-Limit | TMPOL | TEMP_LIMIT | 0xFFFF h(two's complement, positive values only) |
| Power Over-Limit | POL | PWR_LIMIT | 0x7FFF h(two's complement) |
A read of the DIAG_ALRT register is used to determine which diagnostic has triggered the ALERT pin. This register, shown in Table 6-13, is also used to monitor other associated diagnostics as well as configure some ALERT pin functions.
• Alert latch enable — In case the ALERT pin is triggered, this function holds the value of the pin even after all diagnostic conditions have cleared. A read of the DIAG_ALRT register resets the status of the ALERT pin. This function is enabled by setting the ALATCH bit.
• Conversion ready enable — Enables the ALERT pin to assert when an ADC conversion has completed and output values are ready to be read through the digital interface. This function is enabled by setting the CNVR bit. The conversion completed events can also be read through the CNVRF bit regardless of the CNVR bit setting.
• Alert comparison on averaged output — Allows the out-of-range threshold value to be compared to the averaged data values produced by the ADC. This helps to additionally remove noise from the output data when compared to the out-of-range threshold to avoid false alerts due to noise. However, the diagnostic is delayed due to the time needed for averaging. This function is enabled by setting the SLOWALERT bit.
• Alert polarity — Allows the device to invert the active state of the ALERT pin. Note that the ALERT pin is an open-drain output that must be pulled-up by a resistor. The ALERT pin is active-low by default and can be configured for active high function using the APOL control bit.
Other diagnostic functions that are not reported by the ALERT pin but are available by reading the DIAG_ALRT register:
• Math overflow — Indicated by the MATHOF bit, reports when an arithmetic operation has caused an internal register overflow.
• Memory status — Indicated by the MEMSTAT bit, monitors the health of the device non-volatile trim memory. This bit must always read '1' when the device is operating properly.
When the ALERT pin is configured to report the ADC conversion complete event, the ALERT pin becomes a multipurpose reporting output. Figure 6-6 shows an example where the device reports ADC conversion complete events while the INA238 device is subject to shunt over voltage (over current) event, bus under voltage event, over temperature event and over power-limit event.

Figure 6-6. Multi-Alert Configuration
6.4 Device Functional Modes
6.4.1 Shutdown Mode
In addition to the two conversion modes (continuous and triggered), the device also has a shutdown mode (selected by the MODE bits in ADC_CONFIG register) that reduces the quiescent current to less than 5 µA and turns off current into the device inputs, reducing the impact of supply drain when the device is not being used. The registers of the device can be written to and read from while the device is in shutdown mode. The device remains in shutdown mode until another triggered conversion command or continuous conversion command is received.
The device can be triggered to perform conversions while in shutdown mode. When a conversion is triggered, the ADC starts conversion; once conversion completes the device returns to the shutdown state.
Note that the shutdown current is specified with an inactive communications bus. Active clock and data activity increases the current consumption as a function of the bus frequency as shown in Figure 5-23.
6.4.2 Power-On Reset
Power-on reset (POR) is asserted when $\mathsf { V } _ { \mathsf { S } }$ drops below 1.26V (typical) at which all of the registers are reset to the default values. A manual device reset can be initiated by setting the RST bit in the CONFIG register. The default power-up register values are shown in the reset column for each register description. Links to the register descriptions are shown in Section 6.6
6.5 Programming
6.5.1 I2C Serial Interface
The INA238 operates only as a secondary device on both the SMBus and I2C interfaces. Connections to the bus are made through the open-drain SDA and SCL lines. The SDA and SCL pins feature integrated spike suppression filters and Schmitt triggers to minimize the effects of input spikes and bus noise. Although the device integrates spike suppression into the digital I/O lines, proper layout techniques help minimize the amount of coupling into the communication lines. This noise introduction can occur from capacitive coupling signal edges between the two communication lines themselves or from other switching noise sources present in the system. Routing traces in parallel with ground in between layers on a printed-circuit board (PCB) typically reduces the effects of coupling between the communication lines. Shielded communication lines reduce the possibility of unintended noise coupling into the digital I/O lines that can be incorrectly interpreted as start or stop commands.
The INA238 supports the transmission protocol for fast mode (1 kHz to 400 kHz) and high-speed mode (1 kHz to 2.94 MHz). All data bytes are transmitted most significant byte first and follow the SMBus 3.0 transfer protocol.
To communicate with the INA238, the main device must first address secondary devices through a secondary device address byte. The secondary device address byte consists of seven address bits and a direction bit that indicates whether the action is to be a read or write operation.
The device has two address pins, A0 and A1. Table 6-2 lists the pin logic levels for each of the 16 possible addresses. The device samples the state of pins A0 and A1 on every bus communication. Establish the pin states before any activity on the interface occurs. When connecting the SDA pin to either A0 or A1 to set the device address, additional hold time of 100 ns is needed on the MSB of the I2C address to verify the correct device addressing.
Table 6-2. Address Pins and Secondary Device Addresses
| A1 | A0 | Secondary Device Address |
| GND | GND | 1000000 |
| GND | VS | 1000001 |
| GND | SDA | 1000010 |
| GND | SCL | 1000011 |
| VS | GND | 1000100 |
| VS | VS | 1000101 |
| VS | SDA | 1000110 |
| VS | SCL | 1000111 |
| SDA | GND | 1001000 |
| SDA | VS | 1001001 |
| SDA | SDA | 1001010 |
| SDA | SCL | 1001011 |
| SCL | GND | 1001100 |
| SCL | VS | 1001101 |
| SCL | SDA | 1001110 |
| SCL | SCL | 1001111 |
6.5.1.1 Writing to and Reading Through the I2C Serial Interface
Accessing a specific register on the INA238 is accomplished by writing the appropriate value to the register pointer. Refer to Section 6.6 for a complete list of registers and corresponding addresses. The value for the register pointer (as shown in Figure 6-9) is the first byte transferred after the secondary device address byte with the R/W bit low. Every write operation to the device requires a value for the register pointer.
Writing to a register begins with the first byte transmitted by the main device. This byte is the secondary device address, with the R/W bit low. The device then acknowledges receipt of a valid address. The next byte transmitted by the main device is the address of the register to be accessed. This register address value updates the register pointer to the desired internal device register. The next two bytes are written to the register addressed by the register pointer. The device acknowledges receipt of each data byte. The main device can terminate data transfer by generating a start or stop condition.
When reading from the device, the last value stored in the register pointer by a write operation determines which register is read during a read operation. To change the register pointer for a read operation, a new value must be written to the register pointer. This write is accomplished by issuing a secondary device address byte with the R/ W bit low, followed by the register pointer byte. No additional data are required. The main device then generates a start condition and sends the address byte for the secondary device with the R/W bit high to initiate the read command. The next byte is transmitted by the secondary device and is the most significant byte of the register indicated by the register pointer. This byte is followed by an Acknowledge from the main device; then the secondary device transmits the least significant byte. The main device may or may not acknowledge receipt of the second data byte. The main device can terminate data transfer by generating a Not-Acknowledge after receiving any data byte, or generating a start or stop condition. If repeated reads from the same register are desired, continually sending the register pointer bytes is not necessary; the device retains the register pointer value until the value is changed by the next write operation.
Figure 6-7 shows the write operation timing diagram. Figure 6-8 shows the read operation timing diagram. These diagrams are shown for reading/writing to 16 bit registers.
Register bytes are sent most-significant byte first, followed by the least significant byte.

A. The value of the Secondary Device Address byte is determined by the settings of the A0 and A1 pins. Refer to Table 6-2.
B. The device does not support packet error checking (PEC) or perform clock stretching.
Figure 6-7. Timing Diagram for Write Word Format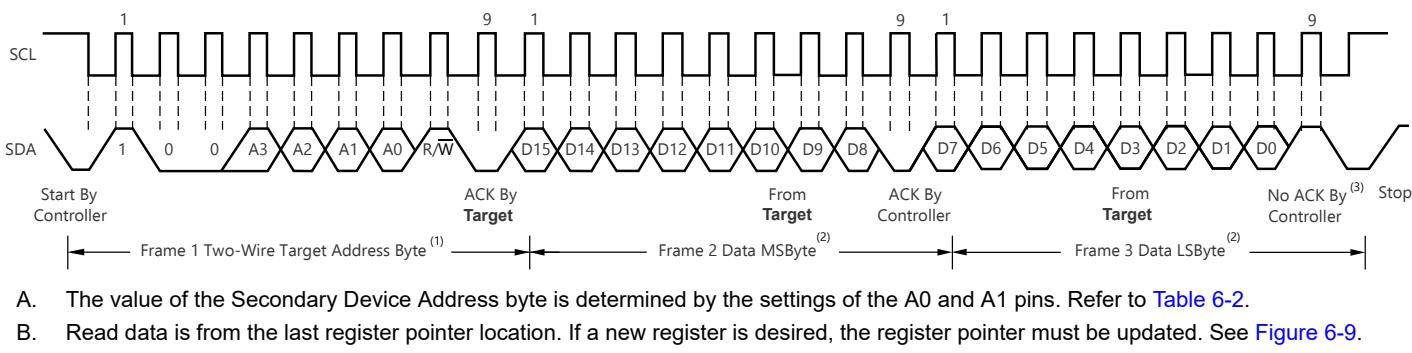
B. Read data is from the last register pointer location. If a new register is desired, the register pointer must be updated. See Figure 6-9
C. ACK by the main device can also be sent.
D. The device does not support packet error checking (PEC) or perform clock stretching.
Figure 6-8. Timing Diagram for Read Word Format

A. The value of the Secondary Device Address Byte is determined by the settings of the A0 and A1 pins. Refer to Table 6-2
Figure 6-9. Typical Register Pointer Set
6.5.1.2 High-Speed I2C Mode
When the bus is idle, both the SDA and SCL lines are pulled high by the pullup resistors. The main device generates a start condition followed by a valid serial byte containing high-speed (HS) main device code 00001XXX. This transmission is made in fast (400 kHz) or standard (100 kHz) (F/S) mode at no more than 400 kHz. The device does not acknowledge the HS main device code, but does recognize code and switches the internal filters to support 2.94-MHz operation.
The main device then generates a repeated start condition (a repeated start condition has the same timing as the start condition). After this repeated start condition, the protocol is the same as F/S mode, except that transmission speeds up to 2.94 MHz are allowed. Instead of using a stop condition, use repeated start conditions to maintain the bus in HS-mode. A stop condition ends the HS-mode and switches all the internal filters of the device to support the F/S mode.
6.5.1.3 SMBus Alert Response
The INA238 is designed to respond to the SMBus Alert Response address. The SMBus Alert Response provides a quick fault identification for simple secondary devices. When an Alert occurs, the main device can broadcast the Alert Response secondary device address (0001 100) with the Read/Write bit set high. Following this Alert Response, any secondary device that generates an alert identifies itself by acknowledging the Alert Response and sending the address on the bus.
The Alert Response can activate several different target devices simultaneously, similar to the I2C General Call. If more than one target attempts to respond, bus arbitration rules apply. The losing device does not generate an Acknowledge and continues to hold the Alert line low until that device wins arbitration.
6.6 Register Maps
6.6.1 INA238 Registers
Table 6-3 lists the INA238 registers. All register locations not listed in Table 6-3 must be considered as reserved locations and the register contents must not be modified.
Table 6-3. INA238 Registers
| Address | Acronym | Register Name | Register Size (bits) | Section |
| 0h | CONFIG | Configuration | 16 | Go |
| 1h | ADC_CONFIG | ADC Configuration | 16 | Go |
| 2h | SHUNT_CAL | Shunt Calibration | 16 | Go |
| 4h | VSHUNT | Shunt Voltage Measurement | 16 | Go |
| 5h | VBUS | Bus Voltage Measurement | 16 | Go |
| 6h | DIETEMP | Temperature Measurement | 16 | Go |
| 7h | CURRENT | Current Result | 16 | Go |
| 8h | POWER | Power Result | 24 | Go |
| Bh | DIAG_ALRT | Diagnostic Flags and Alert | 16 | Go |
| Ch | SOVL | Shunt Overvoltage Threshold | 16 | Go |
| Dh | SUVL | Shunt Undervoltage Threshold | 16 | Go |
| Eh | BOVL | Bus Overvoltage Threshold | 16 | Go |
| Fh | BUVL | Bus Undervoltage Threshold | 16 | Go |
| 10h | TEMP_LIMIT | Temperature Over-Limit Threshold | 16 | Go |
| 11h | PWR_LIMIT | Power Over-Limit Threshold | 16 | Go |
| 3Eh | MANUFACTURER_ID | Manufacturer ID | 16 | Go |
| 3Fh | DEVICE_ID | Device ID | 16 | Go |
Complex bit access types are encoded to fit into small table cells. Table 6-4 shows the codes that are used for access types in this section.
Table 6-4. INA238 Access Type Codes
| Access Type | Code | Description |
| Read Type | ||
| R | R | Read |
| Write Type | ||
| W | W | Write |
| Reset or Default Value | ||
| -n | Value after reset or the default value | |
6.6.1.1 Configuration (CONFIG) Register (Address = 0h) [reset = 0h]
The CONFIG register is shown in Table 6-5.
Return to the Summary Table.
Table 6-5. CONFIG Register Field Descriptions
| Bit | Field | Type | Reset | Description |
| 15 | RST | R/W | 0h | Reset Bit. Setting this bit to '1' generates a system reset that is the same as power-on reset.Resets all registers to default values.0h = Normal Operation1h = System Reset sets registers to default valuesThis bit self-clears. |
| 14 | RESERVED | R/W | 0h | Reserved. Always reads 0. |
| 13-6 | CONVDLY | R/W | 0h | Sets the Delay for initial ADC conversion in steps of 2 ms.0h = 0 s1h = 2 msFFh = 510 ms |
| 5 | RESERVED | R/W | 0h | Reserved. Always reads 0. |
| 4 | ADCRANGE | R/W | 0h | Shunt full scale range selection across IN+ and IN-.0h = ±163.84 mV1h = ±40.96 mV |
| 3-0 | RESERVED | R | 0h | Reserved. Always reads 0. |
6.6.1.2 ADC Configuration (ADC_CONFIG) Register (Address = 1h) [reset = FB68h]
The ADC_CONFIG register is shown in Table 6-6.
Return to the Summary Table.
Table 6-6. ADC_CONFIG Register Field Descriptions
| Bit | Field | Type | Reset | Description |
| 15-12 | MODE | R/W | Fh | The user can set the MODE bits for continuous or triggered mode on bus voltage, shunt voltage or temperature measurement.0h = Shutdown1h = Triggered bus voltage, single shot2h = Triggered shunt voltage, single shot3h = Triggered shunt voltage and bus voltage, single shot4h = Triggered temperature, single shot5h = Triggered temperature and bus voltage, single shot6h = Triggered temperature and shunt voltage, single shot7h = Triggered bus voltage, shunt voltage and temperature, single shot8h = Shutdown9h = Continuous bus voltage onlyAh = Continuous shunt voltage onlyBh = Continuous shunt and bus voltageCh = Continuous temperature onlyDh = Continuous bus voltage and temperatureEh = Continuous temperature and shunt voltageFh = Continuous bus voltage, shunt voltage and temperature |
| 11-9 | VBUSCT | R/W | 5h | Sets the conversion time of the bus voltage measurement:0h = 50 μs1h = 84 μs2h = 150 μs3h = 280 μs4h = 540 μs5h = 1052 μs6h = 2074 μs7h = 4120 μs |
| 8-6 | VSHCT | R/W | 5h | Sets the conversion time of the shunt voltage measurement:0h = 50 μs1h = 84 μs2h = 150 μs3h = 280 μs4h = 540 μs5h = 1052 μs6h = 2074 μs7h = 4120 μs |
| 5-3 | VTCT | R/W | 5h | Sets the conversion time of the temperature measurement:0h = 50 μs1h = 84 μs2h = 150 μs3h = 280 μs4h = 540 μs5h = 1052 μs6h = 2074 μs7h = 4120 μs |
| 2-0 | AVG | R/W | 0h | Selects ADC sample averaging count. The averaging setting applies to all active inputs.When >0h, the output registers are updated after the averaging has completed.0h = 11h = 42h = 163h = 644h = 1285h = 2566h = 5127h = 1024 |
6.6.1.3 Shunt Calibration (SHUNT_CAL) Register (Address = 2h) [reset = 1000h]
The SHUNT_CAL register is shown in Table 6-7.
Return to the Summary Table.
Table 6-7. SHUNT_CAL Register Field Descriptions
| Bit | Field | Type | Reset | Description |
| 15 | RESERVED | R | 0h | Reserved. Always reads 0. |
| 14-0 | SHUNT_CAL | R/W | 1000h | The register provides the device with a conversion constant value that represents shunt resistance used to calculate current value in Amperes.This also sets the resolution for the CURRENT register.Value calculation under Section 7.1.2. |
6.6.1.4 Shunt Voltage Measurement (VSHUNT) Register (Address = 4h) [reset = 0h]
The VSHUNT register is shown in Table 6-8.
Return to the Summary Table.
Table 6-8. VSHUNT Register Field Descriptions
| Bit | Field | Type | Reset | Description |
| 15-0 | VSHUNT | R | 0h | Differential voltage measured across the shunt output. Two's complement value. Conversion factor: 5 μV/LSB when ADCRANGE = 0 1.25 μV/LSB when ADCRANGE = 1 |
6.6.1.5 Bus Voltage Measurement (VBUS) Register (Address = 5h) [reset = 0h]
The VBUS register is shown in Table 6-9.
Return to the Summary Table.
Table 6-9. VBUS Register Field Descriptions
| Bit | Field | Type | Reset | Description |
| 15-0 | VBUS | R | 0h | Bus voltage output. Two's complement value, however always positive.Conversion factor: 3.125 mV/LSB |
6.6.1.6 Temperature Measurement (DIETEMP) Register (Address = 6h) [reset = 0h]
The DIETEMP register is shown in Table 6-10.
Return to the Summary Table.
Table 6-10. DIETEMP Register Field Descriptions
| Bit | Field | Type | Reset | Description |
| 15-4 | DIETEMP | R | 0h | Internal die temperature measurement. Two's complement value. Conversion factor: 125 m°C/LSB |
| 3-0 | RESERVED | R | 0h | Reserved. Always reads 0. |
6.6.1.7 Current Result (CURRENT) Register (Address = 7h) [reset = 0h]
The CURRENT register is shown in Table 6-11.
Return to the Summary Table.
Table 6-11. CURRENT Register Field Descriptions
| Bit | Field | Type | Reset | Description |
| 15-0 | CURRENT | R | 0h | Calculated current output in Amperes. Two's complement value. Value description under Section 7.1.2. |
6.6.1.8 Power Result (POWER) Register (Address = 8h) [reset = 0h]
The POWER register is shown in Table 6-12.
Return to the Summary Table.
Table 6-12. POWER Register Field Descriptions
| Bit | Field | Type | Reset | Description |
| 23-0 | POWER | R | 0h | Calculated power output.Output value in watts.Unsigned representation. Positive value.Value description under Section 7.1.2. |
6.6.1.9 Diagnostic Flags and Alert (DIAG_ALRT) Register (Address = Bh) [reset = 0001h]
The DIAG_ALRT register is shown in Table 6-13.
Return to the Summary Table.
Table 6-13. DIAG_ALRT Register Field Descriptions
| Bit | Field | Type | Reset | Description |
| 15 | ALATCH | R/W | 0h | When the Alert Latch Enable bit is set to Transparent mode, the Alert pin and Flag bit reset to the idle state when the fault has been cleared.When the Alert Latch Enable bit is set to Latch mode, the Alert pin and Alert Flag bit remain active following a fault until the DIAG_ALRT Register has been read.0h = Transparent1h = Latched |
| 14 | CNVR | R/W | 0h | Setting this bit high configures the Alert pin to be asserted when the Conversion Ready Flag (bit 1) is asserted, indicating that a conversion cycle has completed.0h = Disable conversion ready flag on ALERT pin1h = Enables conversion ready flag on ALERT pin |
| 13 | SLOWALERT | R/W | 0h | When enabled, ALERT function is asserted on the completed averaged value.This gives the flexibility to delay the ALERT until after the averaged value.0h = ALERT comparison on non-averaged (ADC) value1h = ALERT comparison on averaged value |
| 12 | APOL | R/W | 0h | Alert Polarity bit sets the Alert pin polarity.0h = Normal (Active-low, open-drain)1h = Inverted (active-high, open-drain ) |
| 11-10 | RESERVED | R | 0h | Reserved. Always read 0. |
| 9 | MATHOF | R | 0h | This bit is set to 1 if an arithmetic operation resulted in an overflow error.The bit indicates that current and power data can be invalid.0h = Normal1h = OverflowMust be manually cleared by triggering another conversion. |
| 8 | RESERVED | R | 0h | Reserved. Always read 0. |
| 7 | TMPOL | R | 0h | This bit is set to 1 if the temperature measurement exceeds the threshold limit in the temperature over-limit register.0h = Normal1h = Over Temp EventWhen ALATCH =1 this bit is cleared by reading or writing to this register. |
| 6 | SHNTOL | R | 0h | This bit is set to 1 if the shunt voltage measurement exceeds the threshold limit in the shunt over-limit register.0h = Normal1h = Over Shunt Voltage EventWhen ALATCH =1 this bit is cleared by reading or writing to this register. |
| 5 | SHNTUL | R | 0h | This bit is set to 1 if the shunt voltage measurement falls below the threshold limit in the shunt under-limit register.0h = Normal1h = Under Shunt Voltage EventWhen ALATCH =1 this bit is cleared by reading or writing to this register. |
| 4 | BUSOL | R | 0h | This bit is set to 1 if the bus voltage measurement exceeds the threshold limit in the bus over-limit register.0h = Normal1h = Bus Over-Limit EventWhen ALATCH =1 this bit is cleared by reading or writing to this register. |
| 3 | BUSUL | R | 0h | This bit is set to 1 if the bus voltage measurement falls below the threshold limit in the bus under-limit register.0h = Normal1h = Bus Under-Limit EventWhen ALATCH =1 this bit is cleared by reading or writing to this register. |
| 2 | POL | R | 0h | This bit is set to 1 if the power measurement exceeds the threshold limit in the power limit register.0h = Normal1h = Power Over-Limit EventWhen ALATCH =1 this bit is cleared by reading or writing to this register. |
| 1 | CNVRF | R | 0h | This bit is set to 1 if the conversion is completed.0h = Normal1h = Conversion is completeWhen ALATCH =1 this bit is cleared by reading or writing to this register, or starting a new triggered conversion. |
| 0 | MEMSTAT | R | 1h | This bit is set to 0 if a checksum error is detected in the device trim memory space.0h = Memory Checksum Error1h = Normal Operation |
6.6.1.10 Shunt Overvoltage Threshold (SOVL) Register (Address = Ch) [reset = 7FFFh]
If negative values are entered in this register, then a shunt voltage measurement of 0 V trips this alarm. When using negative values for the shunt under and overvoltage thresholds be aware that the over voltage threshold must be set to the larger (that is, less negative) of the two values. The SOVL register is shown in Table 6-14.
Return to the Summary Table.
Table 6-14. SOVL Register Field Descriptions
| Bit | Field | Type | Reset | Description |
| 15-0 | SOVL | R/W | 7FFFh | Sets the threshold for comparison of the value to detect Shunt Overvoltage (overcurrent protection). Two's complement value. Conversion Factor: 5 μV/LSB when ADCRANGE = 01.25 μV/LSB when ADCRANGE = 1. |
6.6.1.11 Shunt Undervoltage Threshold (SUVL) Register (Address = Dh) [reset = 8000h]
The SUVL register is shown in Table 6-15.
Return to the Summary Table.
Table 6-15. SUVL Register Field Descriptions
| Bit | Field | Type | Reset | Description |
| 15-0 | SUVL | R/W | 8000h | Sets the threshold for comparison of the value to detect Shunt Undervoltage (undercurrent protection). Two's complement value. Conversion Factor: 5 μV/LSB when ADCRANGE = 01.25 μV/LSB when ADCRANGE = 1. |
6.6.1.12 Bus Overvoltage Threshold (BOVL) Register (Address = Eh) [reset = 7FFFh]
The BOVL register is shown in Table 6-16.
Return to the Summary Table.
Table 6-16. BOVL Register Field Descriptions
| Bit | Field | Type | Reset | Description |
| 15 | Reserved | R | 0h | Reserved. Always reads 0. |
| 14-0 | BOVL | R/W | 7FFFh | Sets the threshold for comparison of the value to detect Bus Overvoltage (overvoltage protection). Unsigned representation, positive value only. Conversion factor: 3.125 mV/LSB. |
6.6.1.13 Bus Undervoltage Threshold (BUVL) Register (Address = Fh) [reset = 0h]
The BUVL register is shown in Table 6-17.
Return to the Summary Table.
Table 6-17. BUVL Register Field Descriptions
| Bit | Field | Type | Reset | Description |
| 15 | Reserved | R | 0h | Reserved. Always reads 0. |
| 14-0 | BUVL | R/W | 0h | Sets the threshold for comparison of the value to detect Bus Undervoltage (undervoltage protection). Unsigned representation, positive value only. Conversion factor: 3.125 mV/LSB. |
6.6.1.14 Temperature Over-Limit Threshold (TEMP_LIMIT) Register (Address = 10h) [reset = 7FFFh]
The TEMP_LIMIT register is shown in Table 6-18.
Return to the Summary Table.
Table 6-18. TEMP_LIMIT Register Field Descriptions
| Bit | Field | Type | Reset | Description |
| 15-4 | TOL | R/W | 7FFh | Sets the threshold for comparison of the value to detect over temperature measurements. Two's complement value.The value entered in this field compares directly against the value from the DIETEMP register to determine if an over temperature condition exists. Conversion factor: 125 m°C/LSB. |
| 3-0 | Reserved | R | 0 | Reserved, always reads 0 |
6.6.1.15 Power Over-Limit Threshold (PWR_LIMIT) Register (Address = 11h) [reset = FFFFh]
The PWR_LIMIT register is shown in Table 6-19.
Return to the Summary Table.
Table 6-19. PWR_LIMIT Register Field Descriptions
| Bit | Field | Type | Reset | Description |
| 15-0 | POL | R/W | FFFFh | Sets the threshold for comparison of the value to detect power over-limit measurements. Unsigned representation, positive value only. The value entered in this field compares directly against the value from the POWER register to determine if an over power condition exists. Conversion factor: 256 × Power LSB. |
6.6.1.16 Manufacturer ID (MANUFACTURER_ID) Register (Address = 3Eh) [reset = 5449h]
The MANUFACTURER_ID register is shown in Table 6-20.
Return to the Summary Table.
Table 6-20. MANUFACTURER_ID Register Field Descriptions
| Bit | Field | Type | Reset | Description |
| 15-0 | MANFID | R | 5449h | Reads back TI in ASCII. |
6.6.1.17 Device ID (DEVICE_ID) Register (Address = 3Fh) [reset = 2381h]
The DEVICE_ID register is shown in Table 6-21.
Return to the Summary Table.
Table 6-21. DEVICE_ID Register Field Descriptions
| Bit | Field | Type | Reset | Description |
| 15-4 | DIEID | R | 238h | Stores the device identification bits. |
| 3-0 | REV_ID | R | 1h | Device revision identification. |
7 Application and Implementation
Note
Information in the following applications sections is not part of the TI component specification, and TI does not warrant its accuracy or completeness. TI’s customers are responsible for determining suitability of components for their purposes, as well as validating and testing their design implementation to confirm system functionality.
7.1 Application Information
7.1.1 Device Measurement Range and Resolution
The INA238 device supports two input ranges for the shunt voltage measurement. The supported full scale differential input across the IN+ and IN– pins can be either ±163.84 mV or ±40.96 mV depending on the ADCRANGE bit in CONFIG register. The range for the bus voltage measurement is from 0 V to 85 V. The internal die temperature sensor range extends from $- 2 5 6 ~ ^ { \circ } \mathrm { C }$ to $+ 2 5 6 ~ ^ { \circ } \mathrm { C }$ but is limited by the package to $- 4 0 ~ ^ { \circ } \mathsf C$ to $12 5 ^ { \circ } \mathsf { C }$
Table 7-1 provides a description of full scale voltage on shunt, bus, and temperature measurements, along with the associated step size.
Table 7-1. ADC Full Scale Values
| PARAMETER | FULL SCALE VALUE | RESOLUTION |
| Shunt voltage | ±163.84 mV (ADCRANGE = 0) | 5 μV/LSB |
| ±40.96 mV (ADCRANGE = 1) | 1.25 μV/LSB | |
| Bus voltage | 0 V to 85 V | 3.125 mV/LSB |
| Temperature | -40 °C to +125 °C | 125 m°C/LSB |
The device shunt voltage measurements, bus voltage, and temperature measurements can be read through the VSHUNT, VBUS, and DIETEMP registers, respectively. The digital output in VSHUNT and VBUS registers is 16-bits. The shunt voltage measurement can be positive or negative due to bidirectional currents in the system; therefore the data value in VSHUNT can be positive or negative. The VBUS data value is always positive. The output data can be directly converted into voltage by multiplying the digital value by the respective resolution size. The digital output in the DIETEMP register is 12-bit and can be directly converted to °C by multiplying by the above resolution size. This output value can also be positive or negative.
Furthermore, the device provides the flexibility to report calculated current in Amperes, power in Watts as described in Section 7.1.2.
7.1.2 Current and Power Calculations
For the INA238 device to report current values in Ampere units, a constant conversion value must be written in the SHUNT_CAL register that is dependent on the maximum measured current and the shunt resistance used in the application. The SHUNT_CAL register is calculated based on the first equation in this section. The term CURRENT_LSB is the LSB step size for the CURRENT register where the current in Amperes is stored. The value of CURRENT_LSB is based on the maximum expected current as shown in the second equation in this section. This value directly defines the resolution of the CURRENT register. While the smallest CURRENT_LSB value yields highest resolution, selecting a higher round-number (no higher than 8x) value for the CURRENT_LSB is common for simplifying the conversion of the CURRENT.
The ${ \mathsf { R } } _ { \mathsf { S H U N T } }$ term is the resistance value of the external shunt used to develop the differential voltage across the IN+ and IN– pins. Use the following equation for ADCRANGE = 0. For ADCRANGE = 1, the value of SHUNT_CAL must be multiplied by 4.
$$
\mathrm {SHUNT_CAL} = 8 1 9. 2 \times 1 0 ^ {6} \times \mathrm {CURENT_LSB} \times \mathrm {R_ {SHUNT}}\tag{1}
$$
where
$8 1 9 . 2 \times 1 0 ^ { 6 }$ is an internal fixed value used to verify that scaling is maintained properly.
• the value of SHUNT_CAL must be multiplied by 4 for ADCRANGE = 1.
$$
\mathrm {Current_LSB} = \frac {\mathrm{MaximumExpectedCurrent}}{2 ^ {1 5}}\tag{2}
$$
Note that the current is calculated following a shunt voltage measurement based on the value set in the SHUNT_CAL register. If the value loaded into the SHUNT_CAL register is zero, the current value reported through the CURRENT register is also zero.
After programming the SHUNT_CAL register with the calculated value, the measured current in Amperes can be read from the CURRENT register. The final value is scaled by CURRENT_LSB and calculated in the following equation:
$$
\text { Current } [ \mathrm{A} ] = \text { CURRENT_LSB } \times \text { CURRENT }\tag{3}
$$
where
• CURRENT is the value read from the CURRENT register
The power value can be read from the POWER register as a 24-bit value and converted to Watts by using the following equation:
$$
\text { Power } [ \mathrm{W} ] = 0. 2 \times \text { CURRENT_LSB } \times \text { POWER }\tag{4}
$$
where
• POWER is the value read from the POWER register.
• CURRENT_LSB is the lsb size of the current calculation as defined by Equation 2.
For a design example using these equations refer to Section 7.2.2.
7.1.3 ADC Output Data Rate and Noise Performance
The INA238 noise performance and effective resolution depend on the ADC conversion time. The device also supports digital averaging which can further help decrease digital noise. The flexibility of the device to select ADC conversion time and data averaging offers increased signal-to-noise ratio and achieves the highest dynamic range with lowest offset. The profile of the noise at lower signals levels is dominated by the system noise that is comprised mainly of 1/f noise or white noise. The INA238 effective resolution of the ADC can be increased by increasing the conversion time and increasing the number of averages.
Table 7-2 summarizes the output data rate conversion settings supported by the device. The fastest conversion setting is 50 µs. Typical noise-free resolution is represented as Effective Number of Bits (ENOB) based on device measured data. The ENOB is calculated based on noise peak-to-peak values, which verifies that full noise distribution is taken into consideration.
Table 7-2. INA238 Noise Performance
| ADC CONVERSION TIME PERIOD [μs] | OUTPUT SAMPLE AVERAGING [SAMPLES] | OUTPUT SAMPLE PERIOD [ms] | NOISE-FREE ENOB (±163.84-mV) (ADCRANGE = 0) | NOISE-FREE ENOB (±40.96-mV) (ADCRANGE = 1) |
| 50 | 1 | 0.05 | 12.5 | 9.9 |
| 84 | 0.084 | 12.7 | 10.5 | |
| 150 | 0.15 | 13.4 | 11.4 | |
| 280 | 0.28 | 13.7 | 12.2 | |
| 540 | 0.54 | 14.1 | 12.4 | |
| 1052 | 1.052 | 14.1 | 12.7 | |
| 2074 | 2.074 | 15.7 | 13.1 | |
| 4120 | 4.12 | 15.7 | 13.4 | |
| 50 | 4 | 0.2 | 12.7 | 10.6 |
| 84 | 0.336 | 13.7 | 11.4 | |
| 150 | 0.6 | 14.1 | 12.2 | |
| 280 | 1.12 | 14.7 | 12.7 | |
| 540 | 2.16 | 15.7 | 13.4 | |
| 1052 | 4.208 | 15.7 | 14.1 | |
| 2074 | 8.296 | 15.7 | 14.7 | |
| 4120 | 16.48 | 15.7 | 14.7 | |
| 50 | 16 | 0.8 | 13.7 | 11.5 |
| 84 | 1.344 | 15.7 | 12.7 | |
| 150 | 2.4 | 15.7 | 13.4 | |
| 280 | 4.48 | 15.7 | 13.7 | |
| 540 | 8.64 | 15.7 | 14.1 | |
| 1052 | 16.832 | 15.7 | 14.7 | |
| 2074 | 33.184 | 15.7 | 15.7 | |
| 4120 | 65.92 | 16.0 | 15.7 | |
| 50 | 64 | 3.2 | 15.7 | 12.5 |
| 84 | 5.376 | 15.7 | 13.7 | |
| 150 | 9.6 | 15.7 | 14.7 | |
| 280 | 17.92 | 15.7 | 14.7 | |
| 540 | 34.56 | 16.0 | 14.7 | |
| 1052 | 67.328 | 16.0 | 15.7 | |
| 2074 | 132.736 | 16.0 | 15.7 | |
| 4120 | 263.68 | 16.0 | 15.7 | |
| 50 | 128 | 6.4 | 15.7 | 13.1 |
| 84 | 10.752 | 15.7 | 14.1 | |
| 150 | 19.2 | 15.7 | 14.7 | |
| 280 | 35.84 | 16.0 | 15.7 | |
| 540 | 69.12 | 16.0 | 15.7 | |
| 1052 | 134.656 | 16.0 | 15.7 | |
| 2074 | 265.472 | 16.0 | 15.7 | |
| 4120 | 527.36 | 16.0 | 16.0 | |
| 50 | 256 | 12.8 | 15.7 | 13.7 |
| 84 | 21.504 | 15.7 | 14.7 | |
| 150 | 38.4 | 15.7 | 15.7 | |
| 280 | 71.68 | 16.0 | 15.7 | |
| 540 | 138.24 | 16.0 | 15.7 | |
| 1052 | 269.312 | 16.0 | 16.0 | |
| 2074 | 530.944 | 16.0 | 16.0 | |
| 4120 | 1054.72 | 16.0 | 16.0 | |
| 50 | 512 | 25.6 | 15.7 | 14.1 |
| 84 | 43 | 16.0 | 15.7 | |
| 150 | 76.8 | 16.0 | 15.7 | |
| 280 | 143.36 | 16.0 | 15.7 | |
| 540 | 276.48 | 16.0 | 15.7 | |
| 1052 | 538.624 | 16.0 | 16.0 | |
| 2074 | 1061.888 | 16.0 | 16.0 | |
| 4120 | 2109.44 | 16.0 | 16.0 | |
| 50 | 1024 | 51.2 | 15.7 | 14.7 |
| 84 | 86.016 | 15.7 | 15.7 | |
| 150 | 153.6 | 16.0 | 16.0 | |
| 280 | 286.72 | 16.0 | 16.0 | |
| 540 | 552.96 | 16.0 | 16.0 | |
| 1052 | 1077.248 | 16.0 | 16.0 | |
| 2074 | 2123.776 | 16.0 | 16.0 | |
| 4120 | 4218.88 | 16.0 | 16.0 |
7.1.4 Input Filtering Considerations
As previously discussed, INA238 offers several options for noise filtering by allowing the user to select the conversion times and number of averages independently in the ADC_CONFIG register. The conversion times can be set independently for the shunt voltage and bus voltage measurements to allow added flexibility in monitoring of the power-supply bus.
The internal ADC has good inherent noise rejection; however, the transients that occur at or very close to the sampling rate harmonics can cause problems. Because these signals are at 1 MHz and higher, the signals can be managed by incorporating filtering at the input of the device. Filtering high frequency signals enables the use of low-value series resistors on the filter with negligible effects on measurement accuracy. For best results, filter using the lowest possible series resistance (typically 100 Ω or less) and a ceramic capacitor. Recommended values for this capacitor are between 0.1 µF and 1 µF. Figure 7-1 shows the device with a filter added at the input.
Overload conditions are another consideration for the device inputs. The device inputs are specified to tolerate ±40 V differential across the IN+ and IN– pins. A large differential scenario can be a short to ground on the load side of the shunt. This type of event can result in full power-supply voltage across the shunt (as long the power supply or energy storage capacitors support the voltage). Removing a short to ground can result in inductive kickbacks that can exceed the 40-V differential or 85-V common-mode absolute maximum rating of the device. Inductive kickback voltages are best controlled by Zener-type transient-absorbing devices (commonly called transzorbs) combined with sufficient energy storage capacitance. See the Transient Robustness for Current
Shunt Monitors reference design which describes a high-side current shunt monitor used to measure the voltage developed across a current-sensing resistor when current passes through the resistor.
In applications that do not have large energy storage, electrolytic capacitors on one or both sides of the shunt, an input overstress condition can result from an excessive dV/dt of the voltage applied to the input. A hard physical short is the most likely cause of this event. This problem occurs because an excessive dV/dt can activate the ESD protection in the device in systems where large currents are available. Testing demonstrates that the addition of 10-Ω resistors in series with each input of the device sufficiently protects the inputs against this dV/dt failure up to the 40-V maximum differential voltage rating of the device. Selecting these resistors in the range noted has minimal effect on accuracy.

Figure 7-1. Input Filtering
Do not use values greater than 100Ω for $\mathsf { R } _ { \mathsf { F l L T E R } }$ . A resistor higher than 100Ω can degrade gain error and increase non-linearity.
7.2 Typical Application
The low offset voltage and low input bias current of the INA238 allow accurate monitoring of a wide range of currents. To accurately monitor currents with high resolution, select the value of the shunt resistor so that the resulting sense voltage is close to the maximum allowable differential input voltage range (either ±163.84 mV or ±40.96 mV, depending on register settings). The circuit for monitoring currents in a high-side configuration is shown in Figure 7-2.
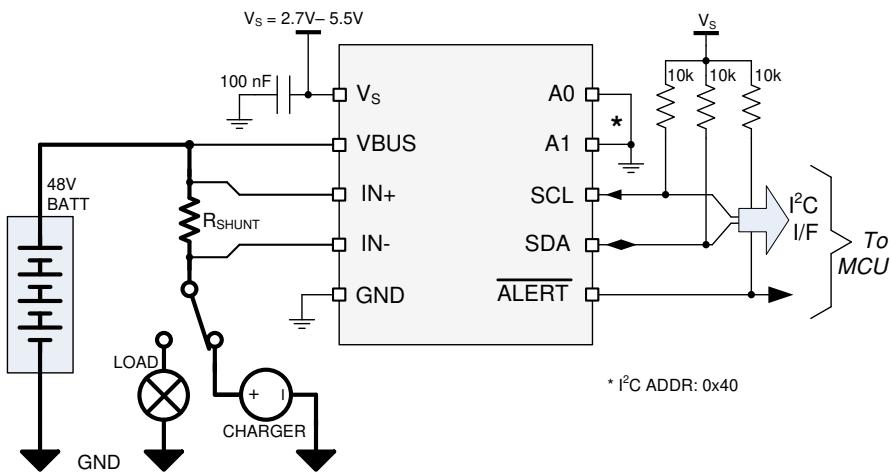
Figure 7-2. INA238 High-Side Sensing Application Diagram
7.2.1 Design Requirements
The INA238 measures the voltage developed across a current-sensing resistor $( \mathsf { R } _ { \mathsf { S H U N T } } )$ when current passes through the device. The device also measures the bus supply voltage and calculates power when calibrated.
The device also comes with alert capability, where the alert pin can be programmed to respond to a user-defined event or a conversion ready notification.
The design requirements for the circuit shown in Figure 7-2 are listed in Table 7-3.
Table 7-3. Design Parameters
| DESIGN PARAMETER | EXAMPLE VALUE |
| Power-supply voltage ( $V_S$ ) | 5 V |
| Bus supply rail ( $V_{CM}$ ) | 48 V |
| Bus supply rail over voltage fault threshold | 52 V |
| Average Current | 6 A |
| Overcurrent fault threshold ( $I_{MAX}$ ) | 10 A |
| ADC Range Selection ( $V_{SENSE\_MAX}$ ) | ±163.84 mV |
| Temperature | 25 °C |
7.2.2 Detailed Design Procedure
7.2.2.1 Select the Shunt Resistor
Using values from Table 7-3, the maximum value of the shunt resistor is calculated based on the value of the maximum current to be sensed $( \mathsf { I } _ { \mathsf { M A X } } )$ and the maximum allowable sense voltage (VSENSE_MAX) for the chosen ADC range. When operating at the maximum current, the differential input voltage must not exceed the maximum full scale range of the device, VSENSE_MAX. Using Equation 5 for the given design parameters, the maximum value for $\mathsf { R } _ { \mathsf { S H U N T } }$ is calculated to be 16.38 mΩ. The closest standard resistor value that is smaller than the maximum calculated value is 16.2 mΩ. Also keep in mind that ${ \mathsf { R s H U N T } }$ must be able to handle the power dissipated across the resistor in the maximum load condition.
$$
\mathrm{R} _ {\text { SHUNT }} < \frac {\mathrm{V} _ {\text { SENSE_MAX }}}{\mathrm{I} _ {\text { MAX }}}\tag{5}
$$
7.2.2.2 Configure the Device
The first step to program the INA238 is to properly set the device and ADC configuration registers. On initia power up the CONFIG and ADC_CONFIG registers are set to the reset values as shown in Table 6-5 and Table 6-6. In this default power on state the device is set to measured on the ±163.84 mV range with the ADC continuously converting the shunt voltage, bus voltage, and temperature. If the default power up conditions do not meet the design requirements, these registers needs to be set properly after each ${ \sf V } _ { \sf S }$ power cycle event.
7.2.2.3 Program the Shunt Calibration Register
The shunt calibration register needs to be correctly programmed at each $\mathsf { V } _ { \mathsf { S } }$ power up for the device to properly report any result based on current. The first step in properly setting this register is to calculate the LSB value for the current by using Equation 2. Applying this equation with the maximum expected current of 10 A results in an LSB size of 305.1758 μA. Applying Equation 1 to the CURRENT_LSB and selected value for the shunt resistor results in a shunt calibration register setting of 4050d (FD2h). Failure to set the value of the shunt calibration register results in a zero value for any result based on current.
7.2.2.4 Set Desired Fault Thresholds
Fault thresholds are set by programming the desired trip threshold into the corresponding fault register. The list of supported fault registers is shown in Table 6-1.
An over current threshold is set by programming the shunt over voltage limit register (SOVL). The voltage that needs to be programmed into this register is calculated by multiplying the over current threshold by the shunt resistor. In this example the over current threshold is 10 A and the value of the current sense resistor is 16.2 mΩ, which give a shunt voltage limit of 162 mV. Once the shunt voltage limit is known, the value for the shunt over voltage limit register is calculated by dividing the shunt voltage limit by the shunt voltage LSB size.
In this example, the calculated value of the shunt over voltage limit register is 162 mV / 5 μV = 32400d (7E90h).
An over voltage fault threshold on the bus voltage is set by programming the bus over voltage limit register (BOVL). In this example the desired over voltage threshold is 52 V. The value that needs to be programmed into this register is calculated by dividing the target threshold voltage by the bus voltage fault limit LSB value of 3.125 mV. For this example, the target value for the BOVL register is 52 V / 3.125 mV = 16640d (4100h).
When setting the power over-limit value, the LSB size used to calculate the value needed in the limit registers are 256 times greater than the power LSB. This is because the power register is a 24 bits in length while the power fault limit register is 16 bits.
Values stored in the alert limit registers are set to the default values after ${ \sf V } _ { \sf S }$ power cycle events and need to be reprogrammed each time power is applied.
7.2.2.5 Calculate Returned Values
Parametric values are calculated by multiplying the returned value by the LSB value. Table 7-4 below shows the returned values for this application example assuming the design requirements shown in Table 7-3.
Table 7-4. Calculating Returned Values
| PARAMETER | Returned Value | LSB Value | Calculated Value |
| Shunt voltage (V) | 19440d | 5 μV/LSB | 0.0972 V |
| Current (A) | 19660d | $10\ A/2^{15} = 305.176\ \mu A/LSB$ | 5.9997 A |
| Bus voltage (V) | 15360d | 3.125 mV/LSB | 48 V |
| Power (W) | 4718604d | Current LSB x 0.2 = 61.035156 μW/LSB | 288 W |
| Temperature (°C) | 200d | 125 m°C/LSB | 25°C |
Shunt Voltage, Current, Bus Voltage (positive only), and Temperature return values in two's complement format. In two's complement format a negative value in binary is represented by having a 1 in the most significant bit of the returned value. These values can be converted to decimal by first inverting all the bits and adding 1 to obtain the unsigned binary value. This value must then be converted to decimal with the negative sign applied. For example, assume a shunt voltage reading returns 1011 0100 0001 0000. This is a negative value due to the MSB having a value of one. Inverting the bits and adding one results in 0100 1011 1111 0000 (19440d) which from the shunt voltage example in Table 7-4 correlates to a voltage of 97.2 mV. Since the returned value is negative the measured shunt voltage value is -97.2 mV.
7.2.3 Application Curves
Figure 7-3 and Figure 7-4 show the ALERT pin response to a bus overvoltage fault with a conversion time of 50 μs, averaging set to 1, and the SLOWALERT bit set to 0 for bus only conversions. For these scope shots, persistence is enabled on the ALERT channel to show the variation in the alert response for many sequentia fault events. If the magnitude of the fault is sufficient the ALERT response can be as fast as one quarter of the ADC conversion time as shown in Figure 7-3. For fault conditions that are just exceeding the limit threshold, the response time for the ALERT pin can vary from approximately 0.5 to 1.5 conversion cycles as shown in Figure 7-4. Variation in the alert response exists because the external fault event is not synchronized to the internal ADC conversion start. Also the ADC is constantly sampling to get a result, so the response time for fault events starting from zero is slower than fault events starting from values near the set fault threshold. Because the timing of the alert can be difficult to predict, in applications where the alert timing is critical, expect an alert response equal to 1.5 times the ADC conversion time for bus voltage or shunt voltage only conversions.
TIME (10 µs / div)
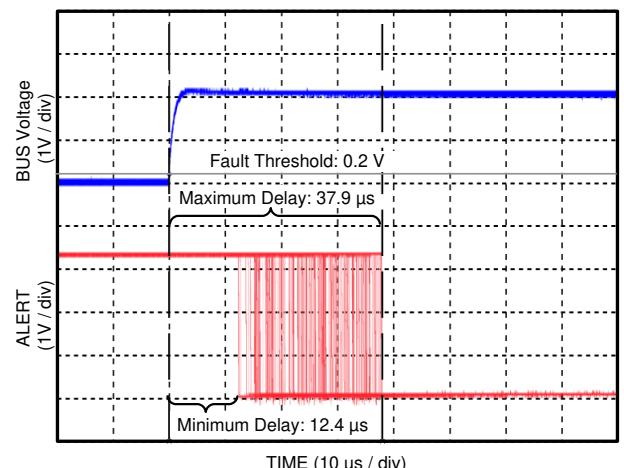
Figure 7-3. Alert Response Time (Sampled Values Significantly Above Threshold)
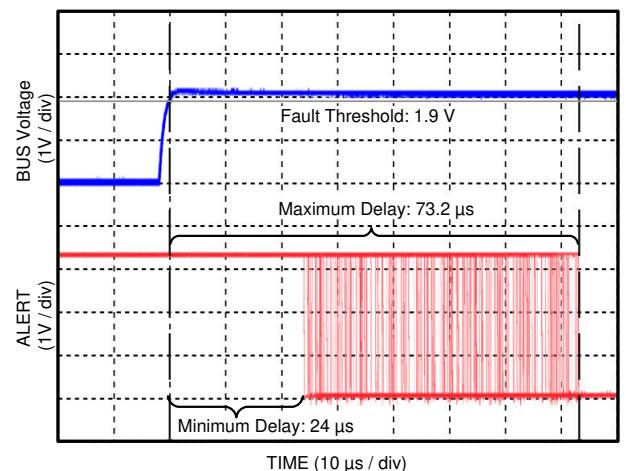
Figure 7-4. Alert Response Time (Sampled Values Slightly Above Threshold)
7.3 Power Supply Recommendations
The input circuitry of the device can accurately measure signals on common-mode voltages beyond the powersupply voltage, ${ \mathsf { V } } _ { \mathsf { S } } .$ For example, the voltage applied to the $\mathsf { V } _ { \mathsf { S } }$ power supply terminal can be 5 V, whereas the load power-supply voltage being monitored (the common-mode voltage) can be as high as 85 V. Note that the device can also withstand the full 0 V to 85 V range at the input terminals, regardless of whether the device has power applied or not. Avoid applications where the GND pin is disconnected while device is actively powered.
Place the required power-supply bypass capacitors as close as possible to the supply and ground terminals of the device. A typical value for this supply bypass capacitor is 0.1 µF. Applications with noisy or high-impedance power supplies can require additional decoupling capacitors to reject power-supply noise.
7.4 Layout
7.4.1 Layout Guidelines
Connect the input pins (IN+ and IN–) to the sensing resistor using a Kelvin connection or a 4-wire connection. This connection technique verifies that only the current-sensing resistor impedance is sensed between the input pins. Poor routing of the current-sensing resistor commonly results in additional resistance present between the input pins. Given the very low ohmic value of the current-sensing resistor, any additional high-current carrying impedance causes significant measurement errors. Place the power-supply bypass capacitor as close as possible to the supply and ground pins.
7.4.2 Layout Example

(1) Connect the VBUS pin to the voltage powering the load for load power calculations..
(2) Can be left floating if unused.
Figure 7-5. INA238 Layout Example
8 Device and Documentation Support
8.1 Receiving Notification of Documentation Updates
To receive notification of documentation updates, navigate to the device product folder on ti.com. Click on Notifications to register and receive a weekly digest of any product information that has changed. For change details, review the revision history included in any revised document.
8.2 Support Resources
TI E2E™ support forums are an engineer's go-to source for fast, verified answers and design help — straight from the experts. Search existing answers or ask your own question to get the quick design help you need.
Linked content is provided "AS IS" by the respective contributors. They do not constitute TI specifications and do not necessarily reflect TI's views; see TI's Terms of Use.
8.3 Trademarks
TI E2E™ is a trademark of Texas Instruments.
All trademarks are the property of their respective owners.
8.4 Electrostatic Discharge Caution

This integrated circuit can be damaged by ESD. Texas Instruments recommends that all integrated circuits be handled with appropriate precautions. Failure to observe proper handling and installation procedures can cause damage.
ESD damage can range from subtle performance degradation to complete device failure. Precision integrated circuits may be more susceptible to damage because very small parametric changes could cause the device not to meet its published specifications.
8.5 Glossary
TI Glossary This glossary lists and explains terms, acronyms, and definitions.
9 Revision History
NOTE: Page numbers for previous revisions may differ from page numbers in the current version.
Changes from Revision A (May 2022) to Revision B (May 2025)
• Updated the numbering format for tables, figures, and cross-references throughout the document................. 1
• Updated equation to calculate notch frequency in Low Latency Digital Filter . . 14
• Changed bits 0-7 in DIAG_ALRT Register table from R/W to R.. . 21
Changes from Revision * (January 2021) to Revision A (May 2022) Page
• Updated the numbering format for tables, figures, and cross-references throughout the document................. 1
• Updated the figures and equations throughput the document to align with the commercial data sheet............ 1
• Changed the Shunt Calibration (SHUNT_CAL) register 14-0 bit name from CURRLSB to SHUNT_CAL.......21
• Changed the Device ID (DEVICE_ID) register reset value.... ... 21
• Changed the TOL 15-4 bit reset value from 7FF0h to 7FFh . .. 21
• Changed the equation definition list in Current Calculation section.... . 29
10 Mechanical, Packaging, and Orderable Information
The following pages include mechanical, packaging, and orderable information. This information is the most current data available for the designated devices. This data is subject to change without notice and revision of this document. For browser-based versions of this data sheet, refer to the left-hand navigation.
PACKAGING INFORMATION
| Orderable part number | Status(1) | Material type(2) | Package | Pins | Package qty | Carrier | RoHS(3) | Lead finish/ Ball material(4) | MSL rating/ Peak reflow(5) | Op temp (°C) | Part marking(6) |
| INA238AIDGSR | Active | Production | VSSOP (DGS) | 10 | 2500 | LARGE T&R | Yes | Call TI | Sn | Level-2-260C-1 YEAR | -40 to 125 | 238I |
| INA238AIDGSR.A | Active | Production | VSSOP (DGS) | 10 | 2500 | LARGE T&R | Yes | SN | Level-2-260C-1 YEAR | -40 to 125 | 238I |
| INA238AIDGST | Obsolete | Production | VSSOP (DGS) | 10 | - | - | Call TI | Call TI | -40 to 125 | 238I |
(1) Status: For more details on status, see our product life cycle.
(2) Material type: When designated, preproduction parts are prototypes/experimental devices, and are not yet approved or released for full production. Testing and final process, including without limitation quality assurance, reliability performance testing, and/or process qualification, may not yet be complete, and this item is subject to further changes or possible discontinuation. If available for ordering, purchases will be subject to an additional waiver at checkout, and are intended for early internal evaluation purposes only. These items are sold without warranties of any kind.
(3) RoHS values: Yes, No, RoHS Exempt. See the TI RoHS Statement for additional information and value definition.
(4) Lead finish/Ball material: Parts may have multiple material finish options. Finish options are separated by a vertical ruled line. Lead finish/Ball material values may wrap to two lines if the finish value exceeds the maximum column width.
(5) MSL rating/Peak reflow: The moisture sensitivity level ratings and peak solder (reflow) temperatures. In the event that a part has multiple moisture sensitivity ratings, only the lowest level per JEDEC standards is shown. Refer to the shipping label for the actual reflow temperature that will be used to mount the part to the printed circuit board.
(6) Part marking: There may be an additional marking, which relates to the logo, the lot trace code information, or the environmental category of the part.
Multiple part markings will be inside parentheses. Only one part marking contained in parentheses and separated by a "~" will appear on a part. If a line is indented then it is a continuation of the previous line and the tw combined represent the entire part marking for that device.
makes no representation or warranty as to the accuracy of such information. Efforts are underway to better integrate information from third parties. TI has taken and continues to take reasonable steps to provide representativ and accurate information but may not have conducted destructive testing or chemical analysis on incoming materials and chemicals. TI and TI suppliers consider certain information to be proprietary, and thus CAS number
In no event shall TI's liability arising out of such information exceed the total purchase price of the TI part(s) at issue in this document sold by TI to Customer on an annual basis.
OTHER QUALIFIED VERSIONS OF INA238 :
Automotive : INA238-Q1
NOTE: Qualified Version Definitions:
• Automotive - Q100 devices qualified for high-reliability automotive applications targeting zero defects
TAPE AND REEL INFORMATION

| A0 | Dimension designed to accommodate the component width |
| B0 | Dimension designed to accommodate the component length |
| K0 | Dimension designed to accommodate the component thickness |
| W | Overall width of the carrier tape |
| P1 | Pitch between successive cavity centers |
Reel Width (W1)
QUADRANT ASSIGNMENTS FOR PIN 1 ORIENTATION IN TAPE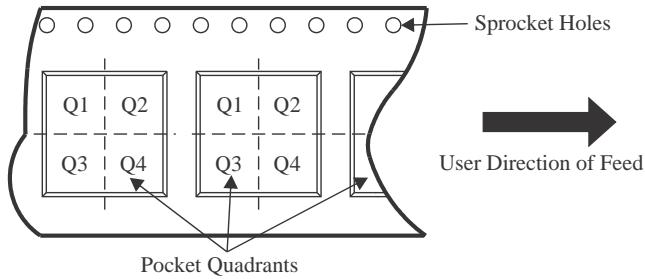
*All dimensions are nomina
| Device | Package Type | Package Drawing | Pins | SPQ | Reel Diameter (mm) | Reel Width W1 (mm) | A0 (mm) | B0 (mm) | K0 (mm) | P1 (mm) | W (mm) | Pin1 Quadrant |
| INA238AIDGSR | VSSOP | DGS | 10 | 2500 | 330.0 | 12.4 | 5.25 | 3.35 | 1.25 | 8.0 | 12.0 | Q1 |
*All dimensions are nominal
| Device | Package Type | Package Drawing | Pins | SPQ | Length (mm) | Width (mm) | Height (mm) |
| INA238AIDGSR | VSSOP | DGS | 10 | 2500 | 366.0 | 364.0 | 50.0 |
SMALL OUTLINE PACKAGE
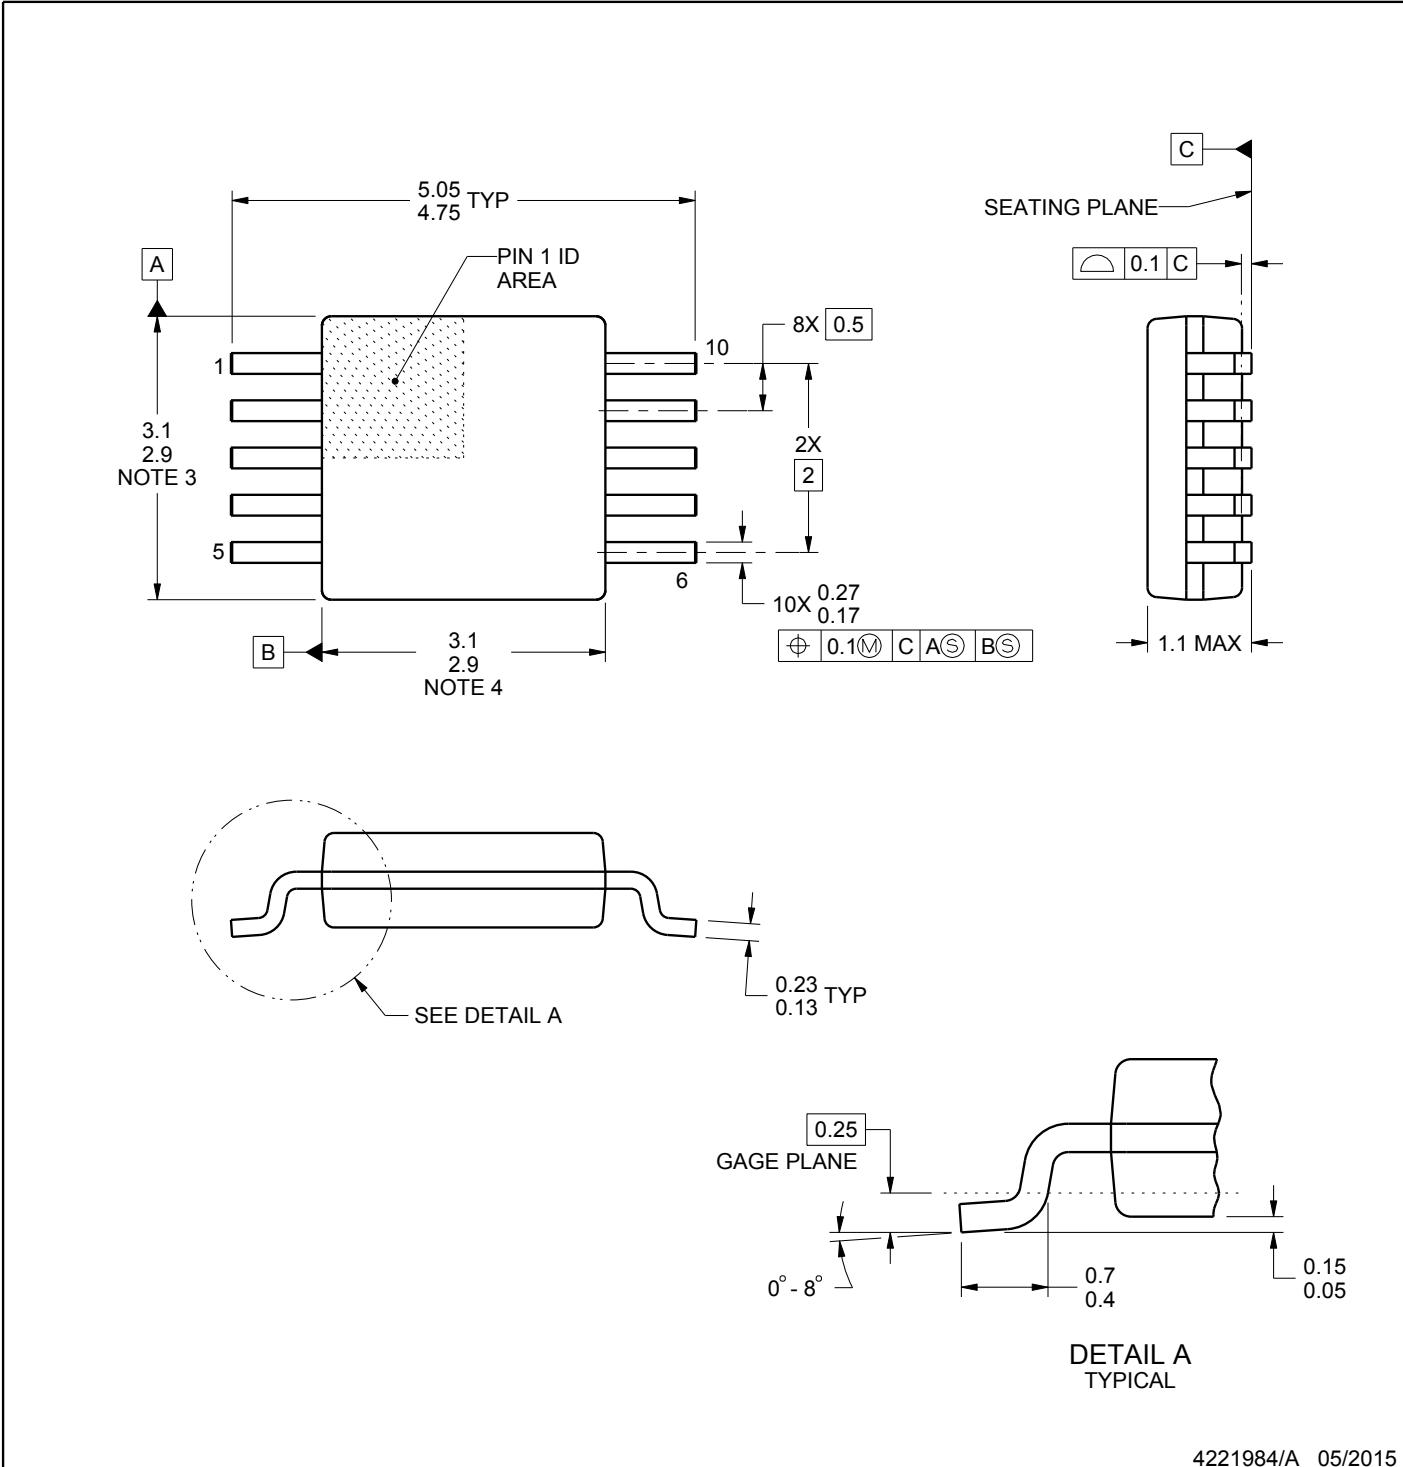
NOTES:
All linear dimensions are in millimeters. Any dimensions in parenthesis are for reference only. Dimensioning and tolerancing per ASME Y14.5M.
This drawing is subject to change without notice.
This dimension does not include mold flash, protrusions, or gate burrs. Mold flash, protrusions, or gate burrs shall not exceed 0.15 mm per side.
SMALL OUTLINE PACKAGE
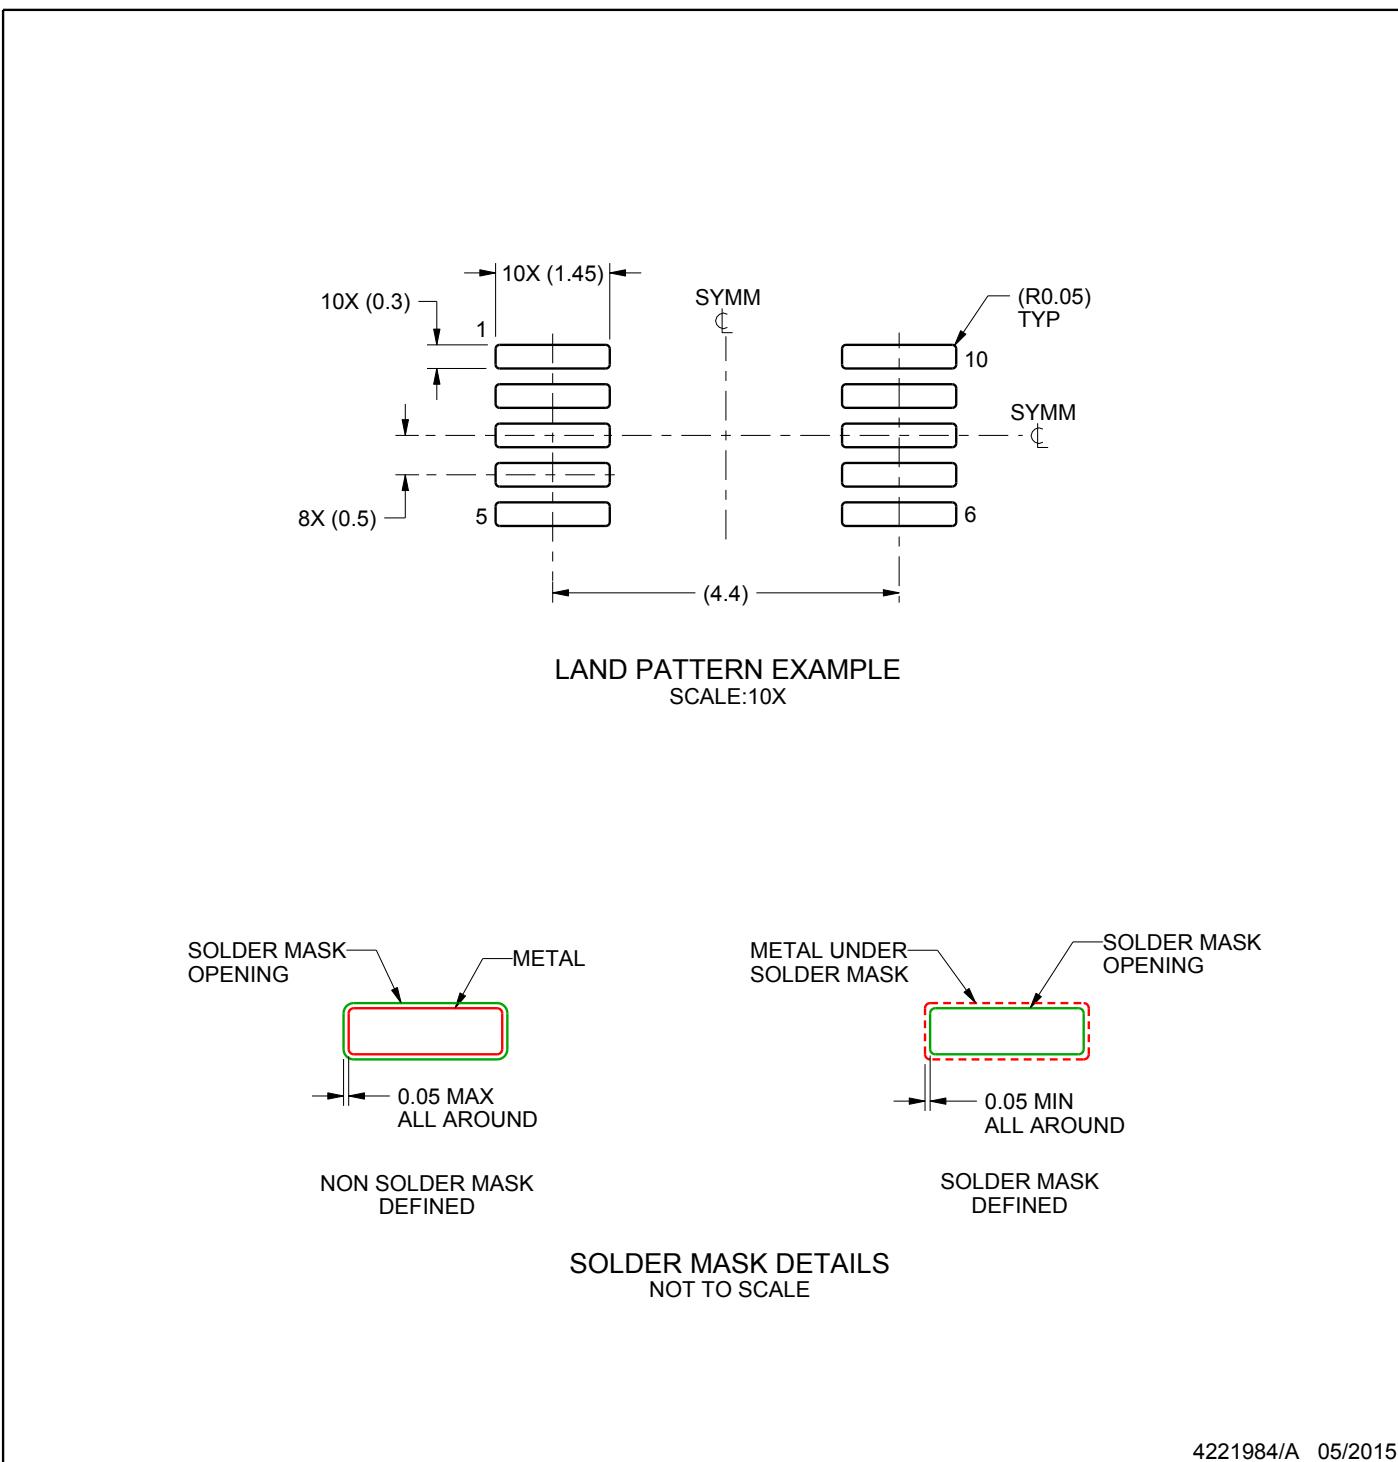
NOTES: (continued)
4221984/A 05/2015
Publication IPC-7351 may have alternate designs.
Solder mask tolerances between and around signal pads can vary based on board fabrication site.

SOLDER PASTE EXAMPLE BASED ON 0.125 mm THICK STENCIL SCALE:10X
4221984/A 05/2015
NOTES: (continued)
Laser cutting apertures with trapezoidal walls and rounded corners may offer better paste release. IPC-7525 may have alternate design recommendations.
Board assembly site may have different recommendations for stencil design.
Figures and diagrams from the PDF
Preview the extracted datasheet assets and open any image in a separate tab for closer inspection.

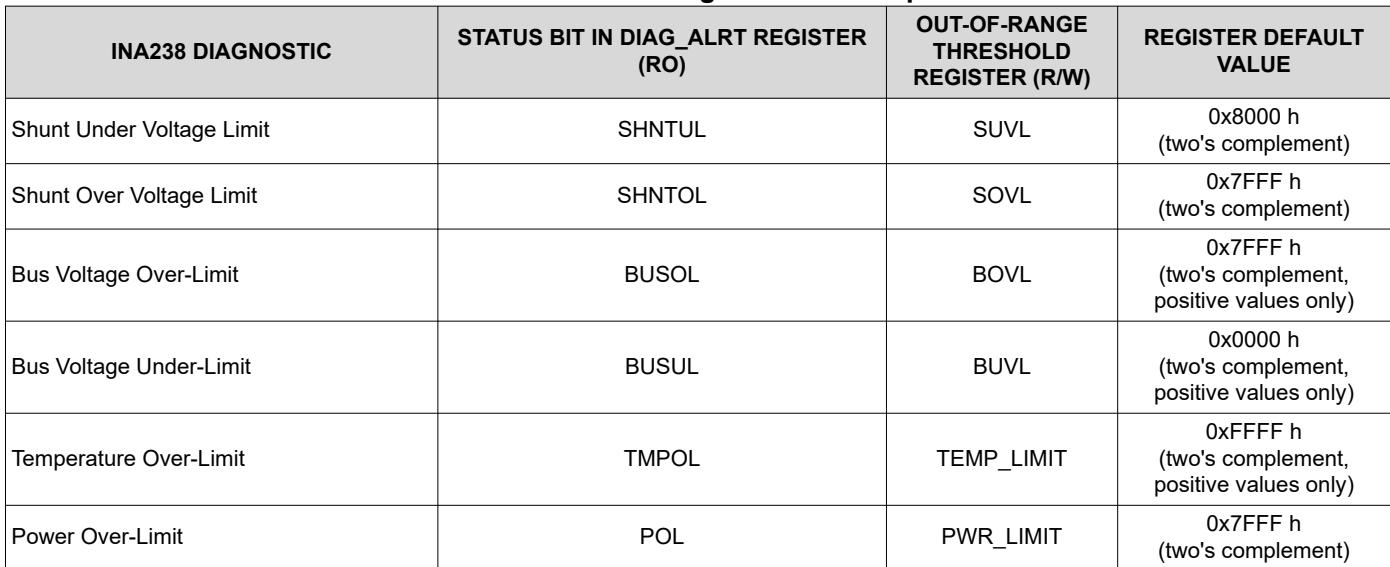

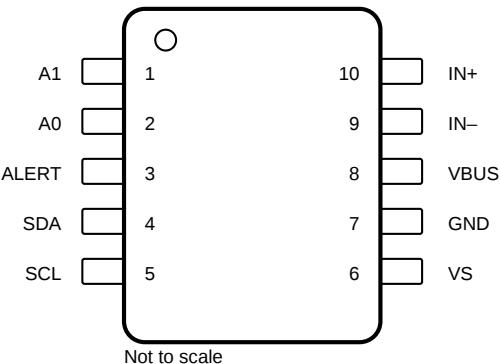
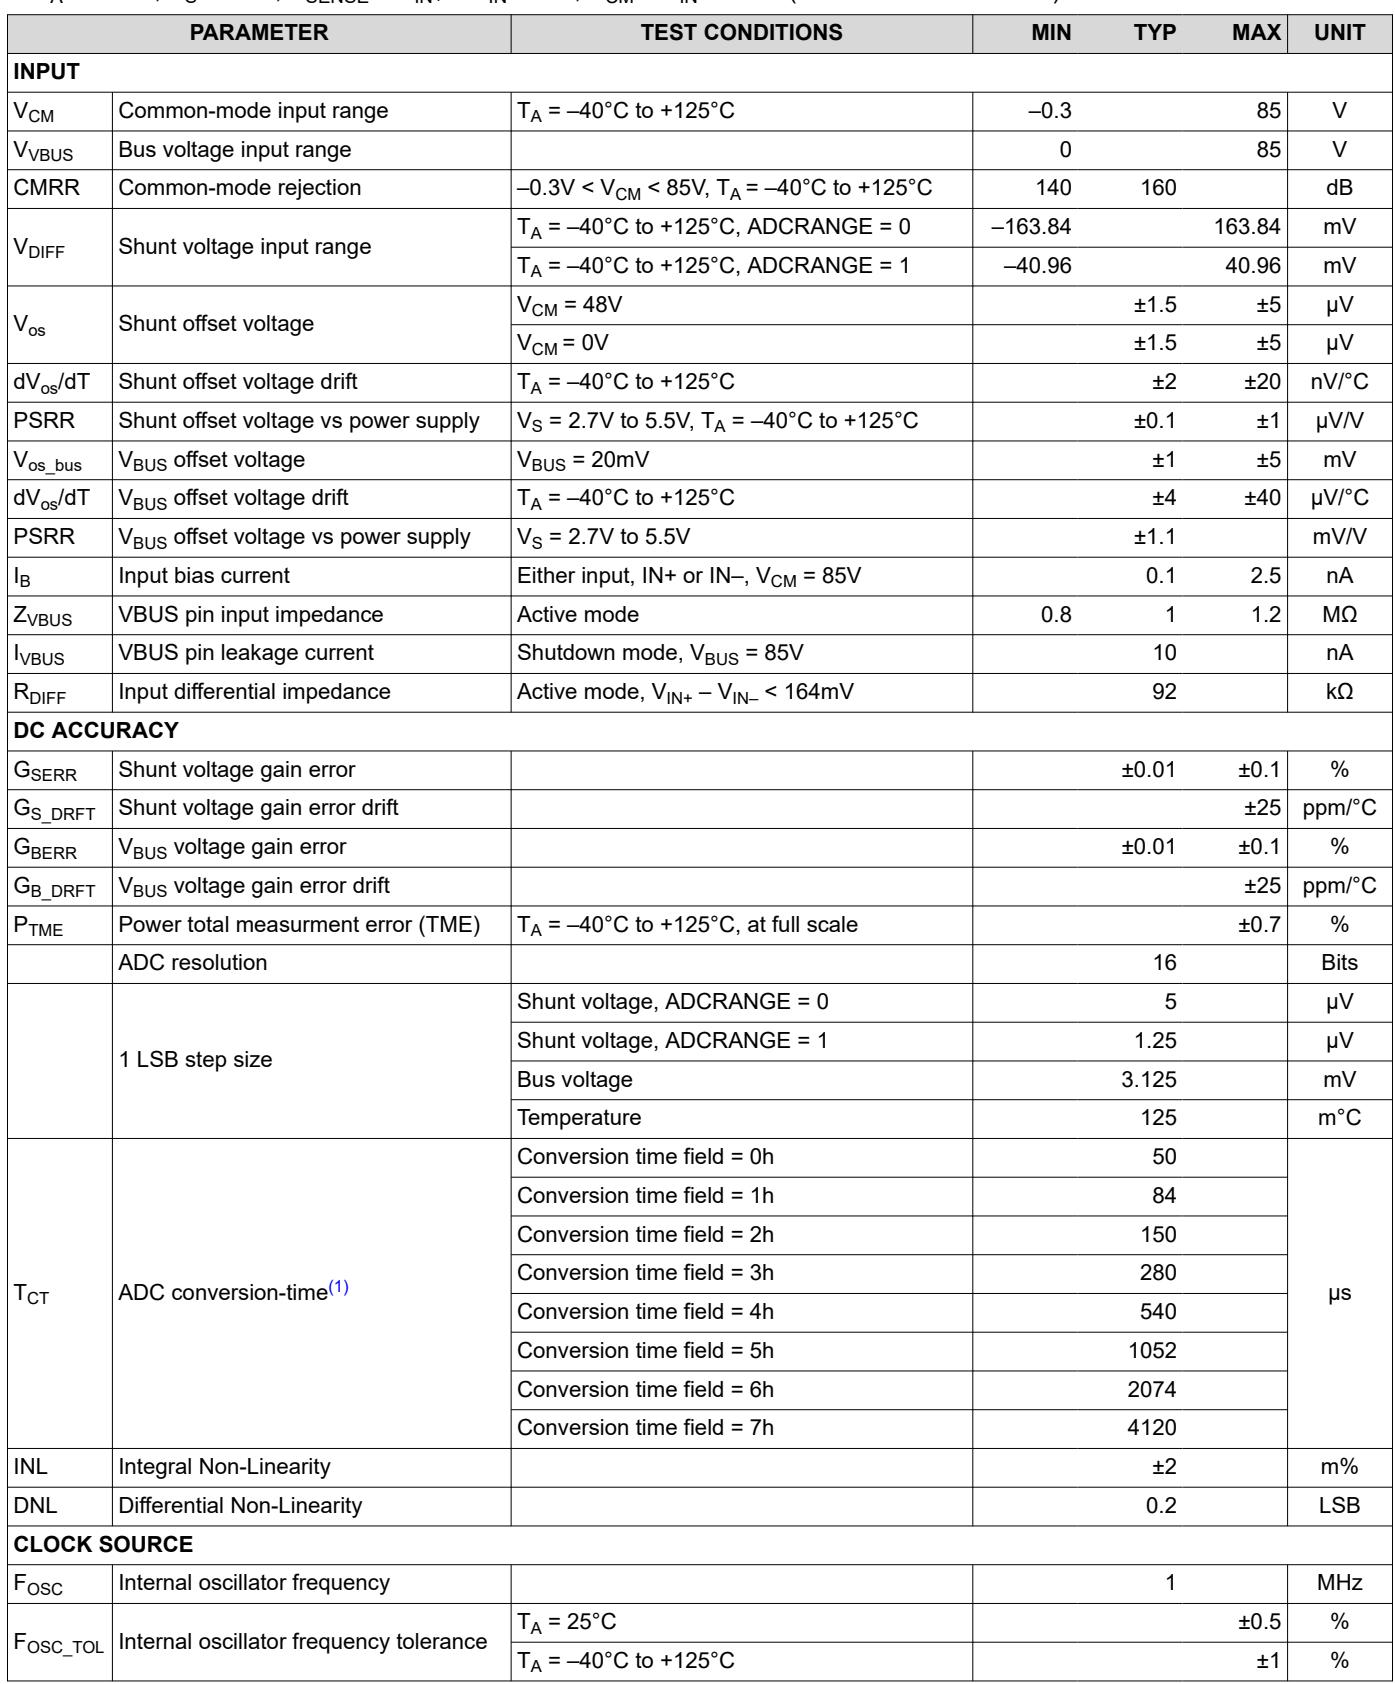



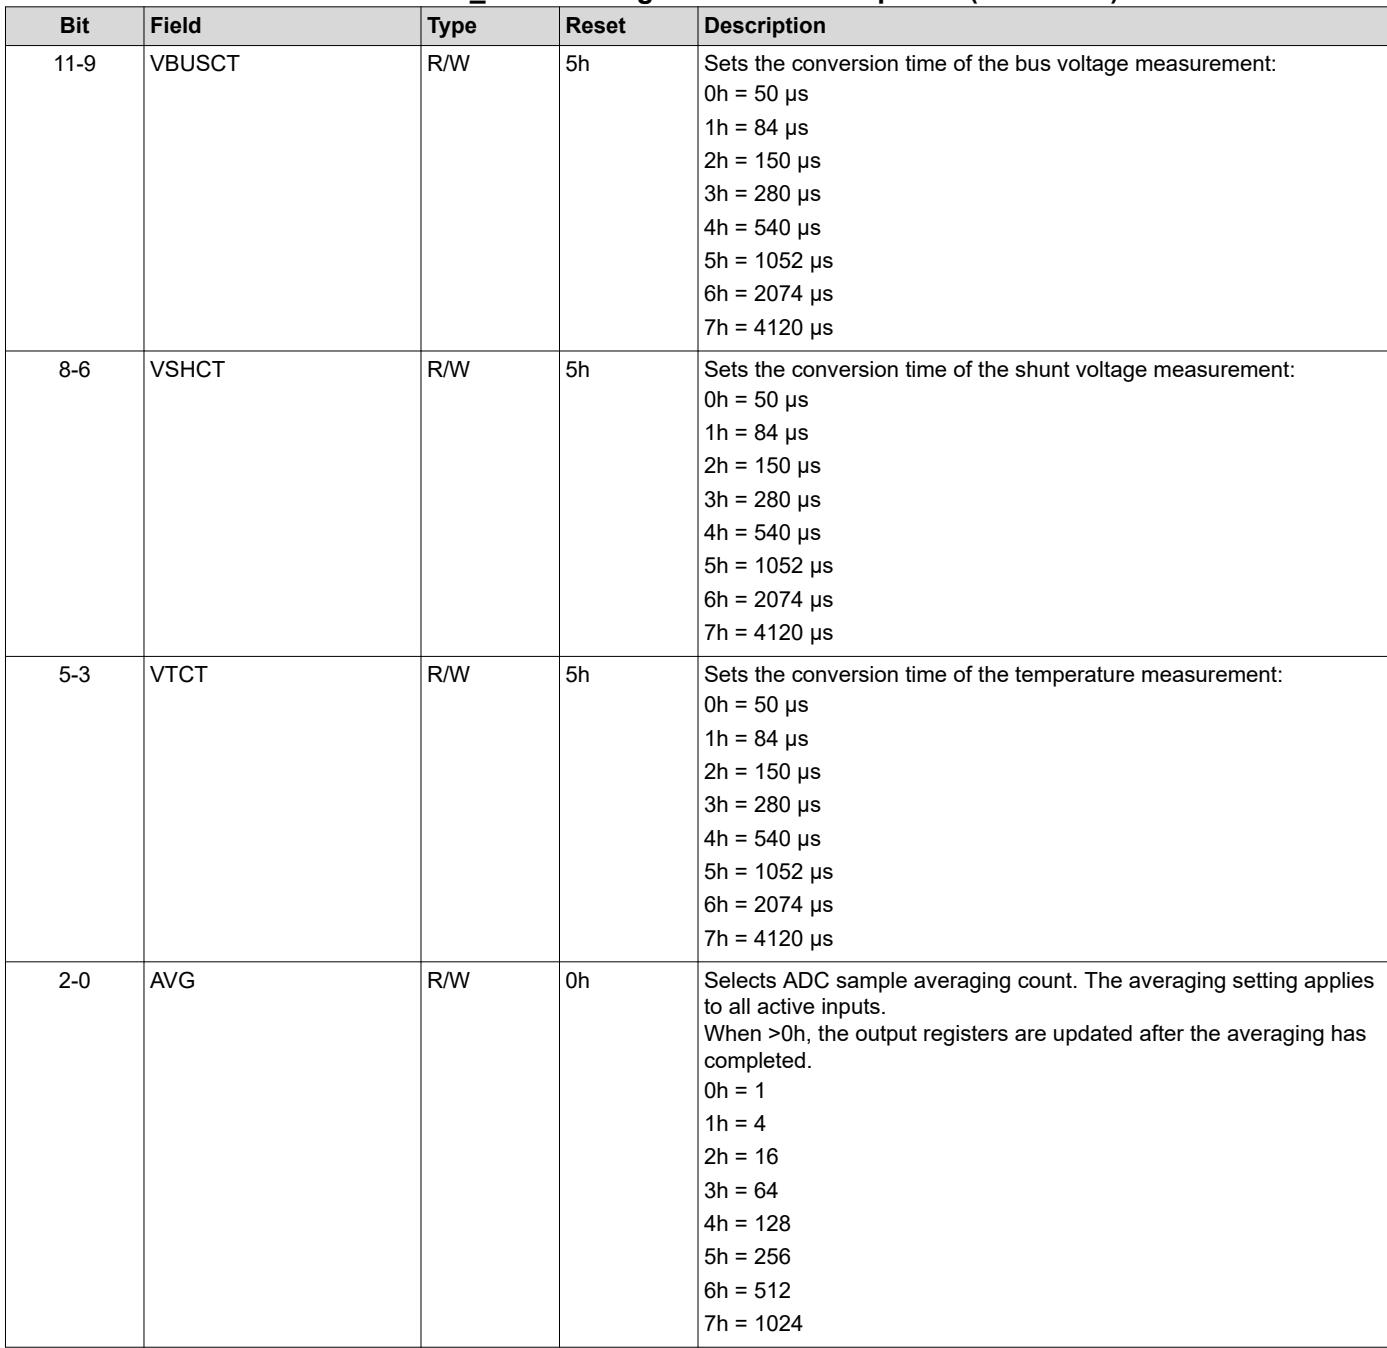
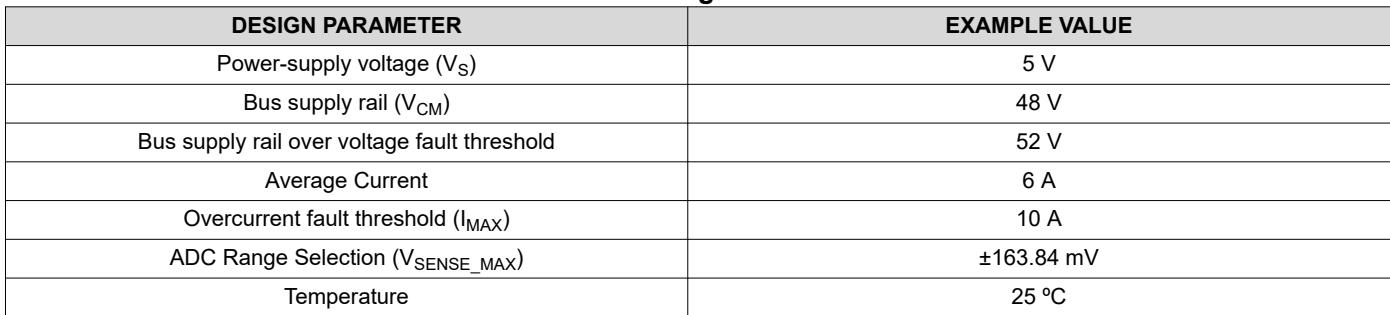

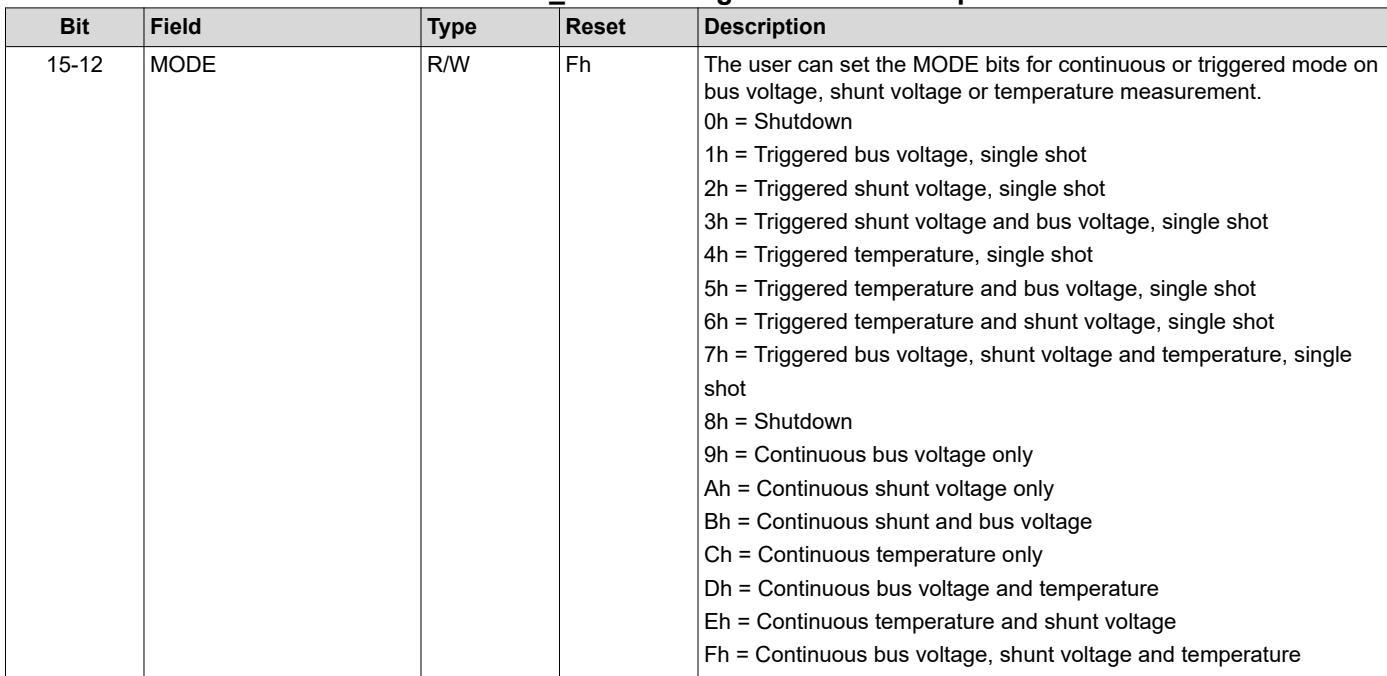

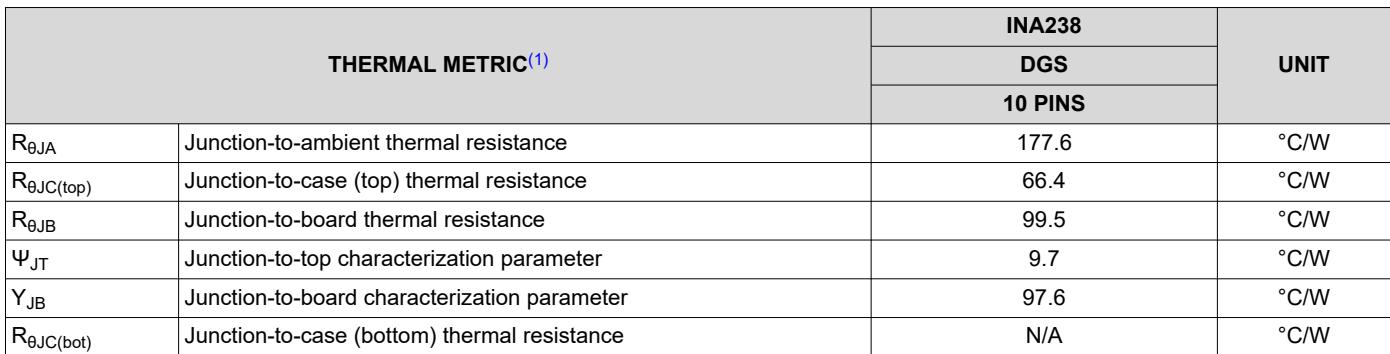

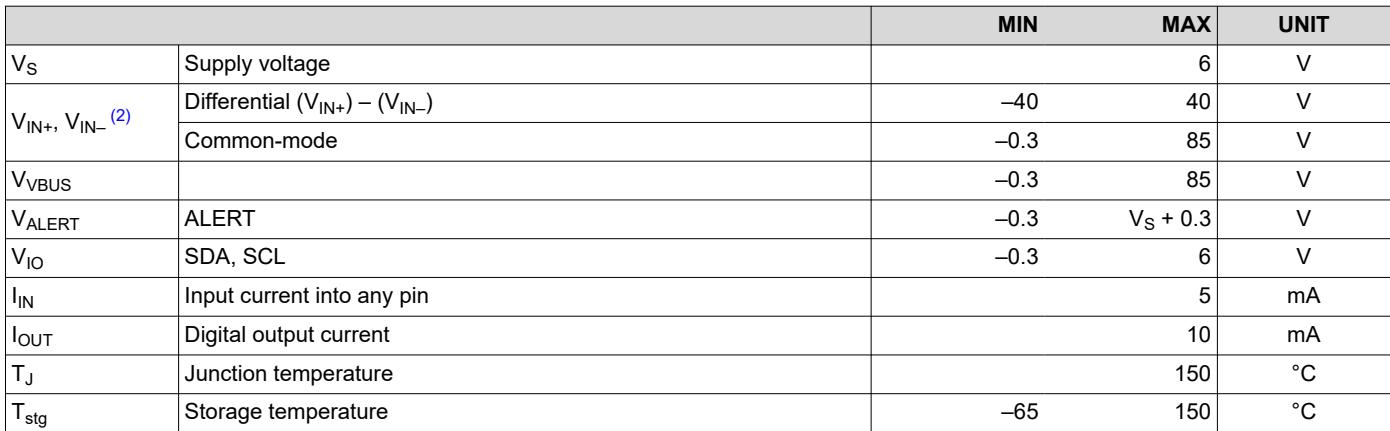
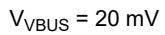

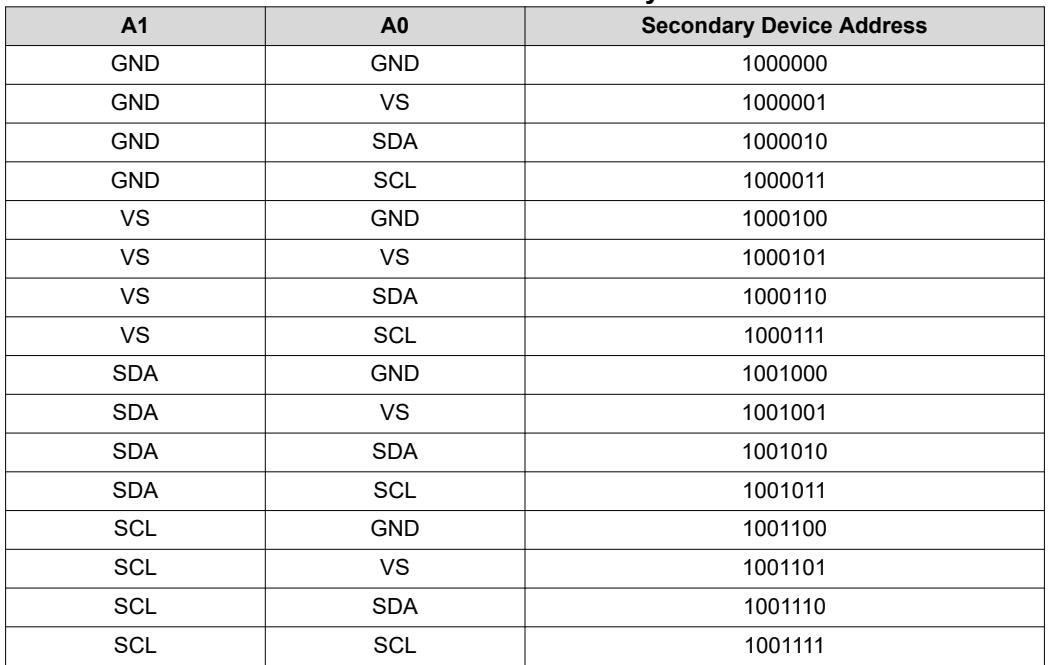
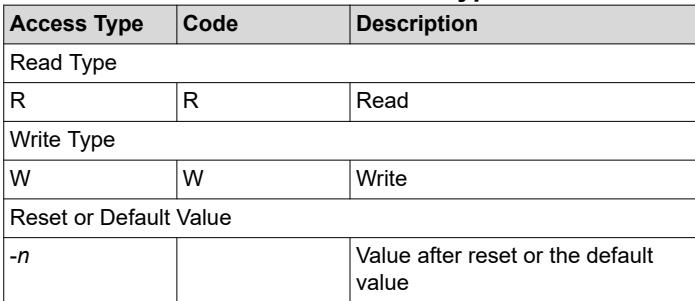

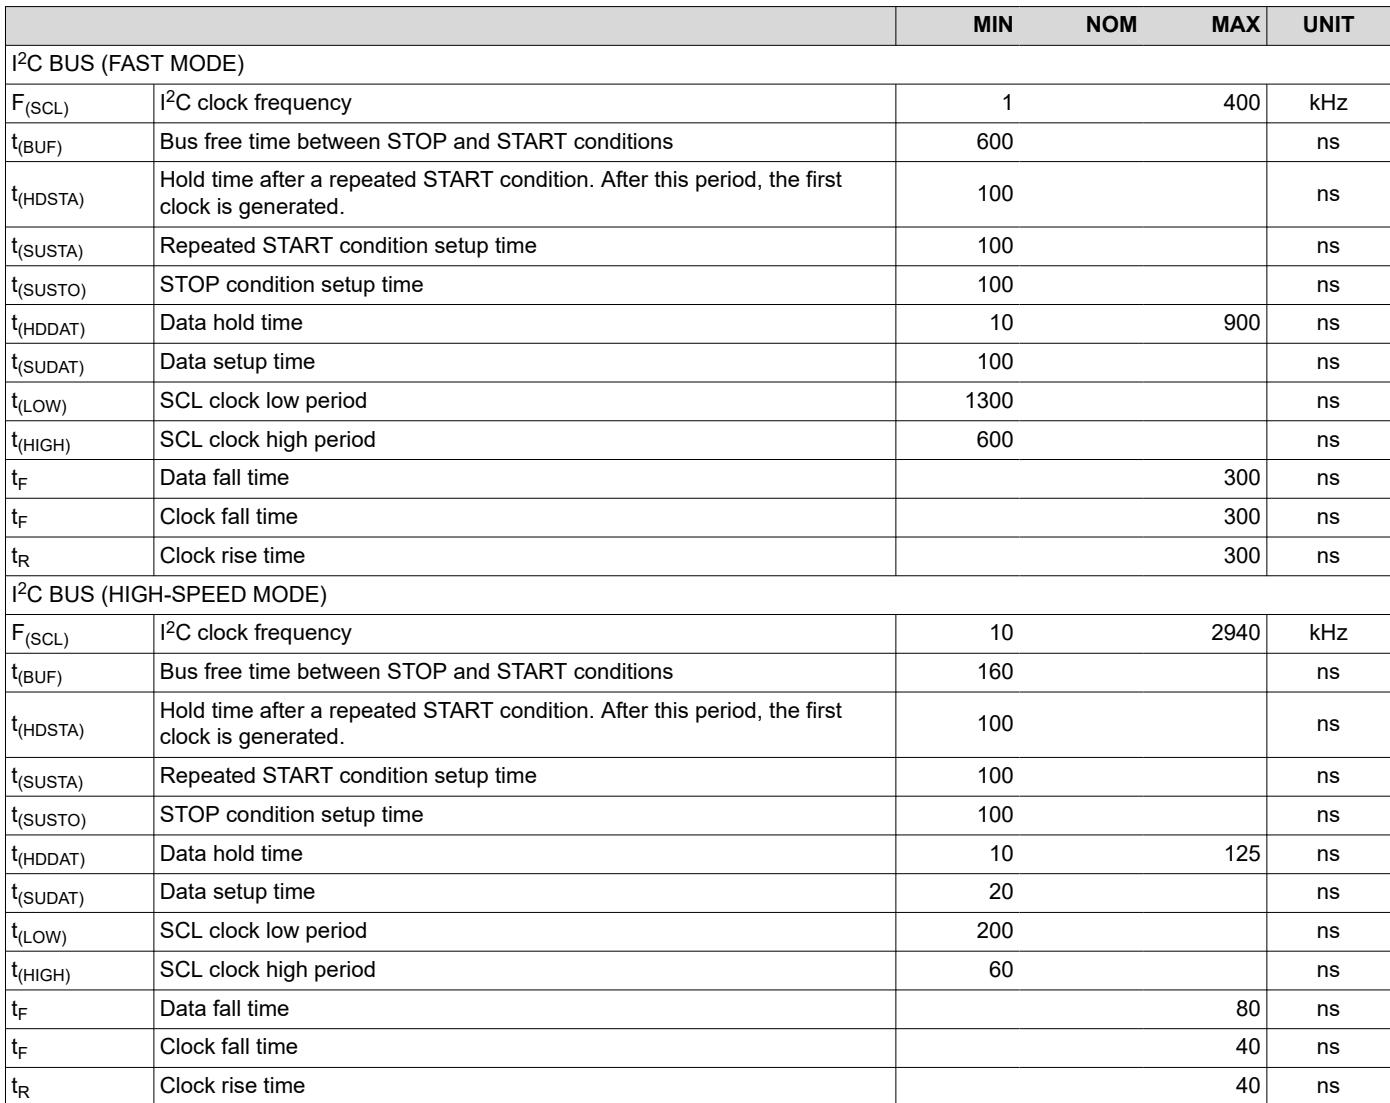

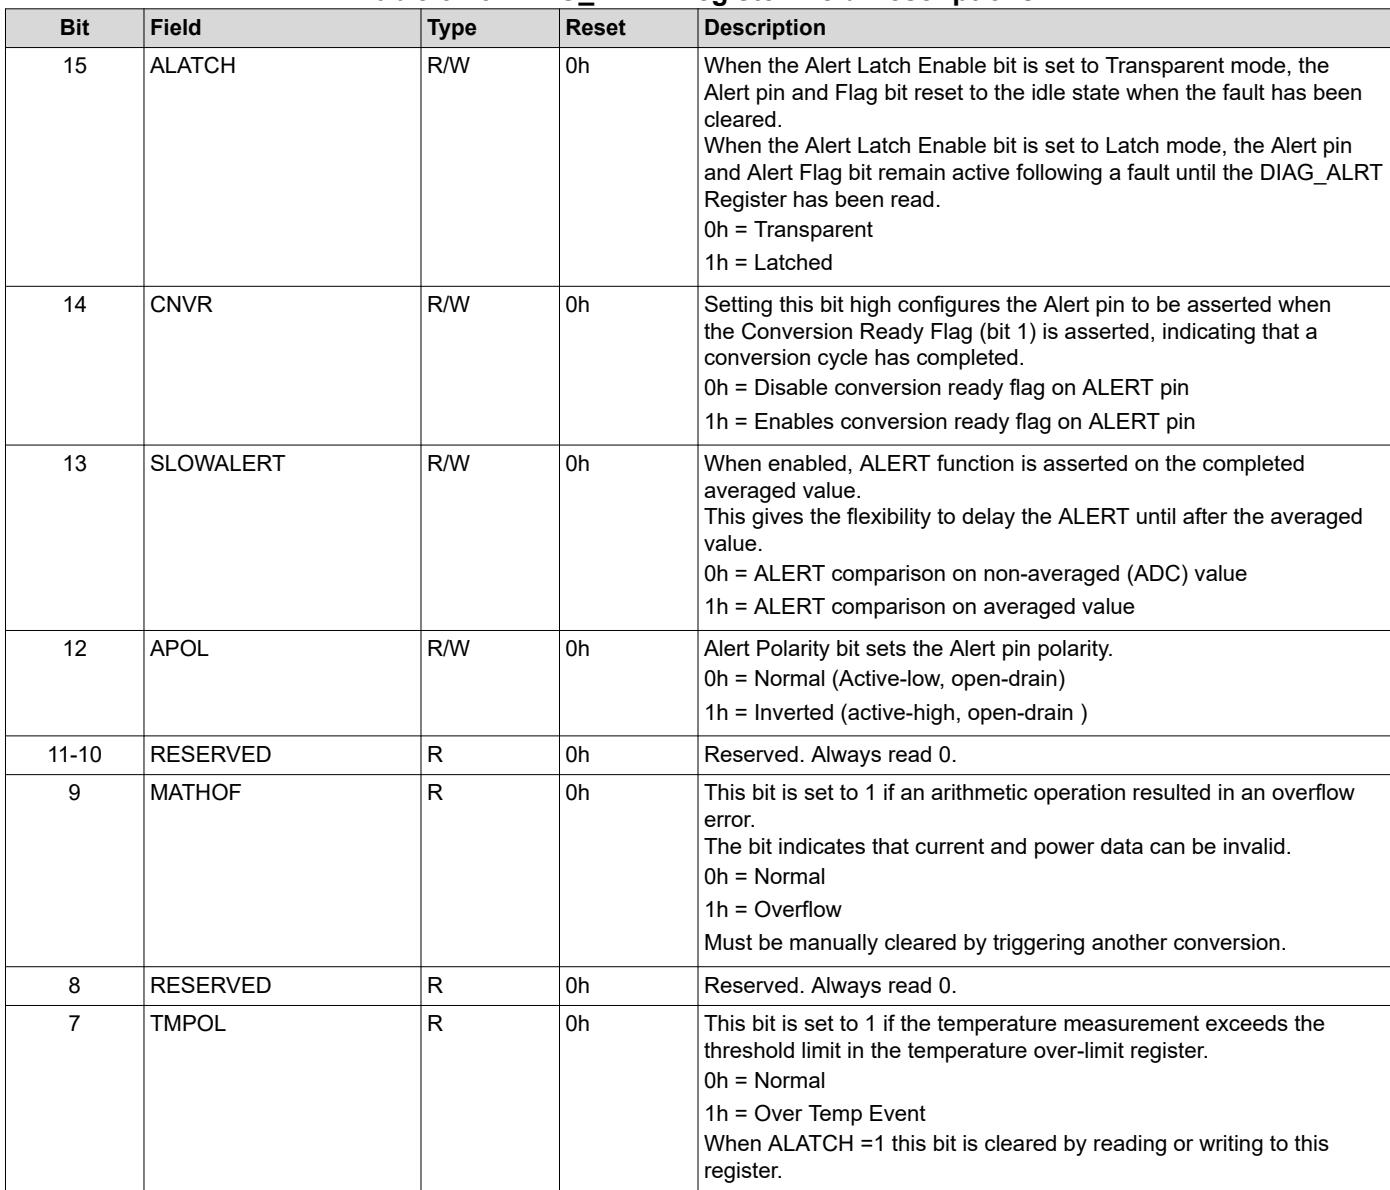

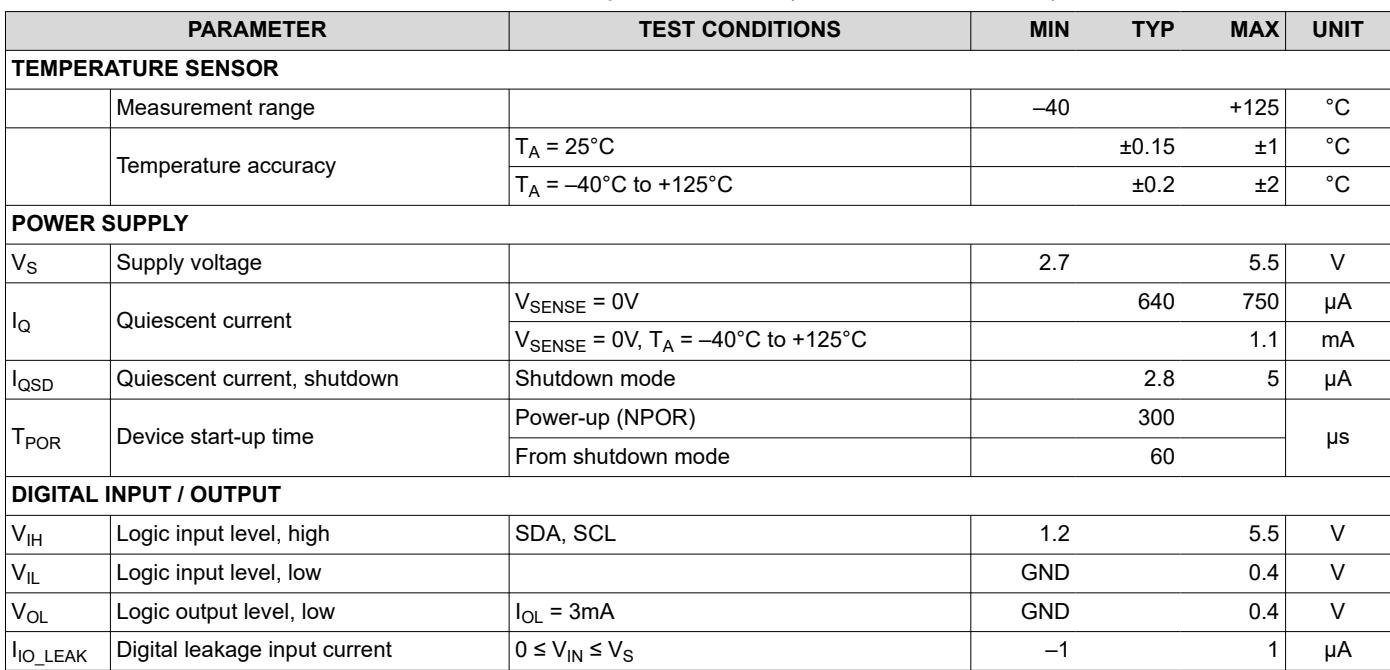

Use this datasheet from any agent
Send the page, markdown, chunks, or search endpoint to ChatGPT, Claude, embedr-app, or your own tooling.