
BME680
Low power gas, pressure, temperature & humidity sensor
BME680 Low power gas, pressure, temperature & humidity sensor

BME680 – Datasheet
Document revision
Document release date
Document number
Technical reference code(s)
1.9
February 2024
Notes
BST-BME680-DS001-09
0 273 141 229; 0 273 141 312
Data and descriptions in this document are subject to change without notice. Product photos and pictures are for illustration purposes only and may differ from the real product appearance.
BME680
Low power gas, pressure, temperature & humidity sensor
The BME680 is a digital 4-in-1 sensor with gas, humidity, pressure and temperature measurement based on proven sensing principles. The sensor module is housed in an extremely compact metal-lid LGA package with a footprint of only 3.0 × 3.0 mm² with a maximum height of 1.00 mm (0.93 ± 0.07 mm). Its small dimensions and its low power consumption enable the integration in battery-powered or frequency-coupled devices, such as handsets or wearables.
Typical applications
• Indoor air quality
• Home automation and control
• Internet of things
• Weather forecast
• GPS enhancement (e.g. time-to-first-fix improvement, dead reckoning, slope detection)
• Indoor navigation (change of floor detection, elevator detection)
• Outdoor navigation, leisure and sports applications
• Vertical velocity indication (rise/sink speed)
Target Devices
• Handsets such as mobile phones, tablet PCs, GPS devices
• Wearables
• Home weather stations
• Smart watches
• Home appliances
• Navigation systems
• Gaming, e.g. flying toys
• IOT devices
Key features
• Package
3.0 mm x 3.0 mm x 0.93 mm metal lid LGA
• Digital interface
I²C (up to 3.4 MHz) and SPI (3 and 4 wire, up to 10 MHz)
• Supply voltage
VDD main supply voltage range: 1.71 V to 3.6 V
VDDIO interface voltage range: 1.2 V to 3.6 V
• Current consumption
2.1 µA at 1 Hz humidity and temperature
3.1 µA at 1 Hz pressure and temperature
3.7 µA at 1 Hz humidity, pressure and temperature
0.09‒12 mA for p/h/T/gas depending on operation mode
0.15 µA in sleep mode
• Operating range -40‒+85 °C, 0‒100% r.H., 300‒1100 hPa
• Individual humidity, pressure and gas sensors can be independently enabled/disabled
• The product is RoHS compliant, halogen-free, MSL1
Key parameters for gas sensor
• Response time $( \tau _ { 3 3 - 6 3 % } )$ < 1 s (for new sensors)
• Power consumption < 0.1 mA in ultra-low power mode
• Output data processing direct index for air quality (IAQ) output
Key parameters for humidity sensor
• Response time (�0−63%) ~8 s
• Accuracy tolerance ±3% r.H.
• Hysteresis ±1.5% r.H.
Key parameters for pressure sensor
• RMS Noise 0.12 Pa, equiv. to 1.7 cm
• Offset temperature coefficient ±1.3 Pa/K, equiv. to ±10.9 cm at 1 °C temperature change
Table of contents
Specification 7
1.1 General Electrical Specification....7
1.2 Gas sensor specification....8
1.3 Humidity sensor specification....10
1.4 Pressure sensor specification....11
1.5 Temperature sensor specification....12Absolute maximum ratings 13
Sensor usage 14
3.1 Sensor modes....14
3.2 Sensor configuration....15
3.2.1 Quick start....15
3.2.2 Sensor configuration flow....16
3.3 Measurement flow....17
3.3.1 Temperature measurement....17
3.3.2 Pressure measurement....18
3.3.3 Humidity measurement....19
3.3.4 IIR filter....21
3.3.5 Gas sensor heating and measurement....21
3.4 Data readout....22
3.4.1 Gas sensor resistance readout....22Software and use cases 24
4.1 BSEC software....24
4.2 Indoor air quality....26Global memory map and register description 27
5.1 General remarks 27
5.2 Memory map 28
5.3 Register description 29
5.3.1 General control registers 29
5.3.2 Temperature, pressure and relative humidity control registers 30
5.3.3 Gas control registers 32
5.3.4 Data registers 35
5.3.5 Status registers 36Digital interfaces 38
6.1 Interface selection 38
6.2 I²C Interface 38
6.2.1 I²C write 39
6.2.2 I²C read 39
6.3 SPI interface 40
6.3.1 SPI write 40
6.3.2 SPI read 41
6.4 Interface parameter specification 41
6.4.1 General interface parameters 41
6.4.2 I²C timings 42
6.4.3 SPI timings 43Pin-out and connection diagram 44
7.1 Pin-out 44
7.2 Connection diagrams 45
7.3 Package dimensions 46
7.4 Landing pattern recommendation 47
7.5 Marking 48
7.5.1 Mass production devices 48
7.5.2 Engineering samples....48
7.6 Soldering guidelines and reconditioning recommendations....49
7.7 Mounting and assembly recommendations....49
7.8 Environmental safety....50
7.8.1 RoHS....50
7.8.2 Halogen content....50
7.8.3 Internal package structure....50
8. Legal disclaimer 51
8.1 Engineering samples....51
8.2 Product use....51
8.3 Application examples and hints....51
9. Document history and modifications
1. Specification
If not stated otherwise,
• all values are valid over the full voltage range,
• all minimum/maximum values are given for the full accuracy temperature range
• minimum/maximum values of drifts, offsets and temperature coefficients are ±3 values over lifetime,
• typical values of currents and state machine timings are determined at $2 5 ^ { \circ } \mathsf C ,$
• minimum/maximum values of currents are determined using corner lots over complete temperature range, and
• minimum/maximum values of state-machine timings are determined using corner lots over $0 { \mathrm { - } } \mathrm { + } 6 5 ^ { \circ } \mathrm { C }$ temperature range.
Besides the general electrical specifications, the following tables are separated for the gas, pressure, humidity and temperature functions of the BME680.
1.1 General Electrical Specification
Table 1: Electrical parameter specification
| OPERATING CONDITIONS BME680 | ||||||
| Parameter | Symbol | Condition | Min | Typ | Max | Unit |
| Supply Voltage Internal Domains1 | $V_{DD}$ | ripple max. 50 mVpp | 1.71 | 1.8 | 3.6 | V |
| Supply Voltage I/O Domain | $V_{DDIO}$ | 1.2 | 1.6 | 3.6 | V | |
| Sleep current | $I_{DDSL}$ | 0.15 | 1 | μA | ||
| Standby current (inactive period of normal mode) | $I_{DDSB}$ | 0.29 | 0.8 | μA | ||
| Current during humidity measurement | $I_{DDH}$ | Max value at 85 °C | 340 | 450 | μA | |
| Current during pressure measurement | $I_{DDP}$ | Max value at -40 °C | 714 | 849 | μA | |
| Current during temperature measurement | $I_{DDT}$ | Max value at 85 °C | 350 | μA | ||
| Start-up time | $t_{startup}$ | Time to first communication after both $V_{DD} > 1.58$ V and $V_{DDIO} > 0.65$ V | 2 | ms | ||
| Power supply rejection ratio (DC) | PSRR | full $V_{DD}$ range | ±0.01 ±5 | %r.H./V Pa/V | ||
| Standby time accuracy | $\Delta t_{standby}$ | ±5 | ±25 | % | ||
1.2 Gas sensor specification
Table 2 lists the gas sensor specification. All the parameters are deduced from lab measurements under controlled environmental conditions, which are compliant to the ISO16000-29 standard “Test methods for VOC detectors”. Detailed procedure to measure the gas sensor is available in the Application Note AN012: Measurement Instructions for Lab Environment.
Referring to Chapter 4, a software solution (BSEC: Bosch Software Environmental Cluster) is available for the BME680. The software is carefully engineered to seamlessly work with the 4-in-1 integrated sensors inside the BME680. Based on an intelligent algorithm, the BSEC provides an index for air quality (IAQ) output. In principle, this output is in an index that can have values between 0 and 500 with a resolution of 1 to indicate or quantify the quality of the air available in the surrounding. Table 4 lists the IAQ system specification. The detailed classification and color coding of the IAQ index is described in Table 4. Furthermore, the BSEC solution supports different operation modes for the gas sensor to address the necessary power budget and update rate requirements of the end-application.
Unless mentioned otherwise, the specifications are deduced from new sensors that have been operated for at least five days mainly in ambient air and consequently have the same history (i.e. same power mode and exposed to the same environment).
Besides ethanol (EtOH) as a target test gas, the sensors are also tested with breath-VOC (b-VOC). The b-VOC mixture, as listed in Table 5, represents the most important compounds in an exhaled breath of healthy humans. The values are derived from several publications on breath analysis studies. The composition does not contain species which would chemically reac to ensure that the mixture is stable for at least 6 months. Furthermore, the composition is also limited to species which can be manufactured in one mixture.
Table 2: Gas sensor parameter specification
| Parameter | Symbol | Condition | Min | Typ | Max | Unit |
| Operational range1 | -40 | 85 | °C | |||
| 10 | 95 | % r.H. | ||||
| Supply Current during heater operation | $I_{DD}$ | Heater target temperature 320 °C, constant operation ( $V_{DD} \leq 1.8 \text{ V}, 25°C$ ) | 9 | 12 | 13 | mA |
| Peak Supply Current | $I_{Peak}$ | Occurs within first ms of switching on the hotplate | 15 | 17 | 18 | mA |
| Average Supply Current( $V_{DD} \leq 1.8 \text{ V}, 25°C$ ) | $I_{DD,IAQ}$ | Ultra-low power mode | 0.09 | mA | ||
| Low power mode | 0.9 | mA | ||||
| Continuous mode | 12 | mA | ||||
| Response time2 (brand-new sensors) | τ33-63% | Ultra-low power mode | 92 | s | ||
| τ33-63% | Low power mode | 1.4 | s | |||
| τ33-63% | Continuous mode | 0.75 | s | |||
| Resolution of gas sensor resistance measurement | 0.05 | 0.08 | 0.11 | % | ||
| Noise in gas sensor resistance (RMS) | $N_R$ | 1.5 | % |
Table 3: IAQ system parameter specification3
| Parameter | Symbol | Condition | Min | Typ | Max | Unit |
| $Accuracy\ status^4$ | $AX_{IAQ}$ | Android compatible | 0 | 3 | ||
| IAQ Resolution | $IAQ_{rs}$ | 1 | ||||
| IAQ Range | $IAQ_{rg}$ | 0 | 500 | |||
| $Sensor-to-sensor\ deviation^5$ | $IAQ_{S2S}$ | All operation modes | ±15% ±15 | |||
| $Durability\ to\ siloxanes^{6,7,8}$ | $IAQ_{S2S}$ | Sensor-to-sensor deviation | ±15% ±15 | |||
| $IAQ_{drift}$ | Drift at low & high concentrations | ±1% ±4 |
Table 4: Index for Air Quality (IAQ) classification and color-coding9
| IAQ Index | Air Quality | Impact (long-term exposure) | Suggested action |
| 0 – 50 | Excellent | Pure air; best for well-being | No measures needed |
| 51 – 100 | Good | No irritation or impact on well-being | No measures needed |
| 101 – 150 | Lightly polluted | Reduction of well-being possible | Ventilation suggested |
| 151 – 200 | Moderately polluted | More significant irritation possible | Increase ventilation with clean air |
| 201 – 250 | Heavily polluted | Exposition might lead to effects like headache depending on type of VOCs | optimize ventilation |
| 251 – 350 | Severely polluted | More severe health issue possible if harmful VOC present | Contamination should be identified if level is reached even w/o presence of people; maximize ventilation & reduce attendance |
| >351 | Extremely polluted | Headaches, additional neurotoxic effects possible | Contamination needs to be identified; avoid presence in room and maximize ventilation |
Table 5: bVOC mixture with Nitrogen as carrier gas
| Molar fraction | Compound | Production tolerance | Certified accuracy |
| 5 ppm | Ethane | 20 % | 5 % |
| 10 ppm | Isoprene /2-methyl-1,3 Butadiene | 20 % | 5 % |
| 10 ppm | Ethanol | 20 % | 5 % |
| 50 ppm | Acetone | 20 % | 5 % |
| 15 ppm | Carbon Monoxide | 10 % | 2 % |
1.3 Humidity sensor specification
Table 6: Humidity parameter specification
| Parameter | Symbol | Condition | Min | Typ | Max | Unit |
| $Operating\ Range^{10}$ | -40 | 25 | 85 | °C | ||
| 0 | 100 | % r.H. | ||||
| Full accuracy range | 0 | 65 | °C | |||
| 10 | 90 | % r.H. | ||||
| Supply Current | $I_{DD,H}$ | 1 Hz forced mode, temperature and humidity measurement | 2.1 | 2.8 | μA | |
| Absolute Accuracy | $A_H$ | 20–80 % r.H., 25 °C, including hysteresis | ±3 | % r.H. | ||
| $Hysteresis^{11}$ | $H_H$ | 10→90→10 % r.H., 25°C | ±1.5 | % r.H. | ||
| Nonlinearity | $NL_H$ | 10→90 % r.H., 25°C | 1.7 | % r.H. | ||
| Response time to complete 63% of $step^{12}$ | τ0-63% | $N_2 (dry) \rightarrow 90 \% r.H., 25°C$ | 8 | s | ||
| Resolution | $R_H$ | 0.008 | % r.H. | |||
| Noise in humidity (RMS) | $N_H$ | Highest oversampling | 0.01 | % r.H. | ||
| Long-term stability | $ΔH_{stab}$ | 10–90 % r.H., 25°C | 0.5 | % r.H./year |
1.4 Pressure sensor specification
Table 7: Pressure parameter specification
| Parameter | Symbol | Condition | Min | Typ | Max | Unit |
| Operating temperature range | $T_A$ | operational | -40 | 25 | 85 | °C |
| full accuracy | 0 | 65 | ||||
| Operating pressure range | P | full accuracy | 300 | 1100 | hPa | |
| Supply current | $I_{DD,LP}$ | 1 Hz forced mode, pressure and temperature, lowest power | 3.1 | 4.2 | μA | |
| Temperature coefficient of $offset^{13}$ | $TCOP$ | 25–40 °C, 900 hPa | ±1.3 | Pa/K | ||
| ±10.9 | cm/K | |||||
| Absolute accuracy pressure | $A_p, full$ | 300–1100 hPa0–65°C | ±0.6 | hPa | ||
| Relative accuracy pressure | $A_{rel}$ | 700–900hPa,25–40 °C, at constant humidity | ±0.12 | hPa | ||
| $A_{rel}$ | 900–1100hPa25–40 °C, at constant humidity | ±0.12 | hPa | |||
| Resolution of pressure output data | $R_P$ | Highest oversampling | 0.18 | Pa | ||
| Noise in pressure | $N_{P,fullBW}$ | Full bandwidth, highest oversampling | 1.4 | Pa | ||
| 11 | cm | |||||
| Reduced bandwidth, highest oversampling | 0.2 | Pa | ||||
| 1.7 | cm | |||||
| Solder drift | Minimum solder height 50μm | -0.5 | 1.2 | +2.0 | hPa | |
| Long-term stability $^{14}$ | $P_{stab}$ | per year | ±1.0 | hPa | ||
| Possible sampling rate | $f_{sample\_P}$ | Lowest oversampling, see chapter 3.3.2 | 157 | 182 | Hz |
1.5 Temperature sensor specification
Table 8: Temperature parameter specification
| Parameter | Symbol | Condition | Min | Typ | Max | Unit |
| Operating temperature range | $T_A$ | operational | -40 | 25 | 85 | °C |
| Supply current | $I_{DD,T}$ | 1 Hz forced mode, temperature measurement only | 1.0 | μA | ||
| Absolute accuracy $temperature^{15}$ | $A_{T,25}$ | 25 °C | ±0.5 | °C | ||
| $A_{T,full}$ | 0–65 °C | ±1.0 | °C | |||
| Output resolution | $R_T$ | API output resolution | 0.01 | °C | ||
| RMS noise | $N_T$ | Lowest oversampling | 0.005 | °C |
2. Absolute maximum ratings
The absolute maximum ratings are determined over the complete temperature range using corner lots. The values are provided in Table 9.
Table 9: Absolute maximum ratings
| Parameter | Condition | Min | Max | Unit |
| Voltage at any supply pin | $V_{DD}$ and $V_{DDIO}$ pin | -0.3 | 4.25 | V |
| Voltage at any interface pin | -0.3 | $V_{DDIO} + 0.3$ | V | |
| Storage temperature | ≤ 65% r.H. | -45 | +85 | °C |
| Pressure | 0 | 20 000 | hPa | |
| ESD | HBM, at any pin | ±2 | kV | |
| Machine model | ±200 | V |
3. Sensor usage
3.1 Sensor modes
The sensor supports low-level power modes: sleep and forced mode. These modes can be selected using the mode<1:0> control register (see Section 5.3.1.3). The key differences between the modes are summarized in Table 10.
After a power-up sequence, the sensor automatically starts in sleep mode. If the device is currently performing a measurement, execution of mode switching commands is delayed until the end of the currently running measurement period. It is important to note that, further mode change commands or other write commands to the control registers are ignored unti the mode change command has been executed. All control registers should be set to the desired values before writing to the mode register.
Table 10: Low-level operation modes
| Operation mode | mode<1:0> | Key features |
| Sleep | 00 | No measurements are performedMinimal power consumption |
| Forced mode | 01 | Single TPHG cycle is performedSensor automatically returns to sleep mode afterwardsGas sensor heater only operates during gas measurement |
In forced mode, temperature, pressure, humidity and gas conversion are performed sequentially. Such a measurement cycle is abbreviated as TPHG (Temperature, Pressure, Humidity and Gas) in the following descriptions. Up to 10 temperature setpoints and heating durations for the gas sensor hot plate can be stored in the sensor registers. In the following, these set points and the corresponding measurements are identified as $\mathsf { G } _ { 0 } - \mathsf { G } _ { 9 } .$ .Figure 1 illustrates the handling of these measurement sequences and the gas sensor hot plate is heated for the forced mode.
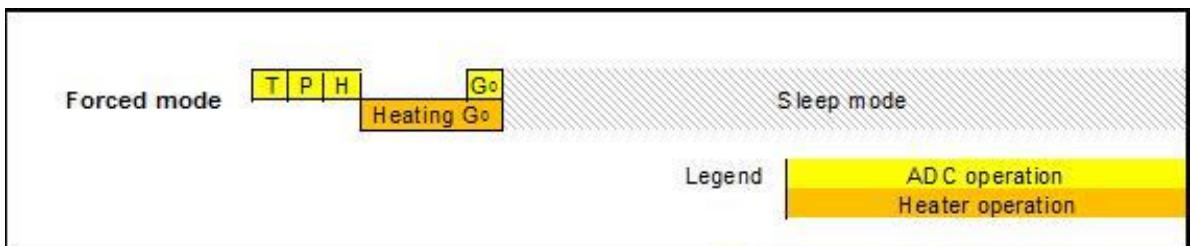
Figure 1: Sequence of ADC and gas sensor heater operation
3.2 Sensor configuration
3.2.1 Quick start
The sensor is configured by writing to a set of control registers (see Chapter 5 for a detailed list of all available registers and their descriptions). This section illustrates, with the help of a basic step-by-step example, how to configure the sensor for simple forced mode measurements with a single heater set-point. For a more detailed description of the measurement flow, please refer to Section 3.3.
In this example, the sensor will be configured to use 2x oversampling for its temperature measurements, 16x oversampling for the pressure signal, and 1x oversampling for humidity. Moreover, the gas sensor hot plate will be configured to be heated for 100 ms at $3 0 0 ^ { \circ } \mathsf { C }$ before the gas measurement is performed.
First, the user must configure the oversampling settings for temperature, pressure and humidity by setting the control registers osrs_t<2:0> and osrs_h<2:0>, respectively. Supported settings range from 16x oversampling down to 0x, which is equivalent to skipping the corresponding sub-measurement. See Section 5.3.2 for further details.
Set humidity oversampling to 1x by writing 0b001 to osrs_ $h { < } 2 { : } 0 { > }$
Set temperature oversampling to 2x by writing 0b010 to osrs $t { < } 2 { : } 0 >$
Set pressure oversampling to 16x by writing 0b101 to osrs $\ J { < } 2 { : } 0 { > }$
It is highly recommended to set first osrs_h<2:0> followed by osrs_t<2:0> and osrs $\ J { < } 2 { : } 0 { > }$ in one write command (see Section 3.3).
Next, the user shall set at least one gas sensor hot plate temperature set-point and heating duration. Up to 10 heating duration can be configured through the control registers gas_wait $. x { < } 7 { : } 0 >$ , where x ranges from 0 to 9. See Section 5.3.3 for definition of register content. The corresponding heater set-points are stored in the registers res_heat_x<7:0>. Section 3.3.5 explains how to convert the target heater temperature, e.g. $3 0 0 ^ { \circ } \mathsf C$ , into a register code. For forced mode operation, the used heater set point is selected by setting the control register nb_conv<3:0> to the heater profile to be used, e.g. to use gas_wait_0<7:0> and res_heat_0<7:0>, nb_conv<3:0> shall be set to 0x0. Finally, gas functionality shall be enabled by setting the run_gas_l bit to 1.
Set gas_wait_0<7:0> to 0x59 to select 100 ms heat up duration
Set the corresponding heater set-point by writing the target heater resistance to res_heat_0<7:0>
Set nb_conv<3:0> to 0x0 to select the previously defined heater settings
Set run_gas_l to 1 to enable gas measurements
Now, a single forced mode measurement with the above settings can be triggered by writing 0b01 to mode<1:0>. For more details on data readout, please see Section 5.3.1.3.
- Set mode<1:0> to 0b01 to trigger a single measurement.
3.2.2 Sensor configuration flow
Picture 2 illustrates which control registers must be set. For details on the individual control registers, please refer to Chapter 5. Moreover, details on the measurement flow for the individual modes can be found in Section 3.3.
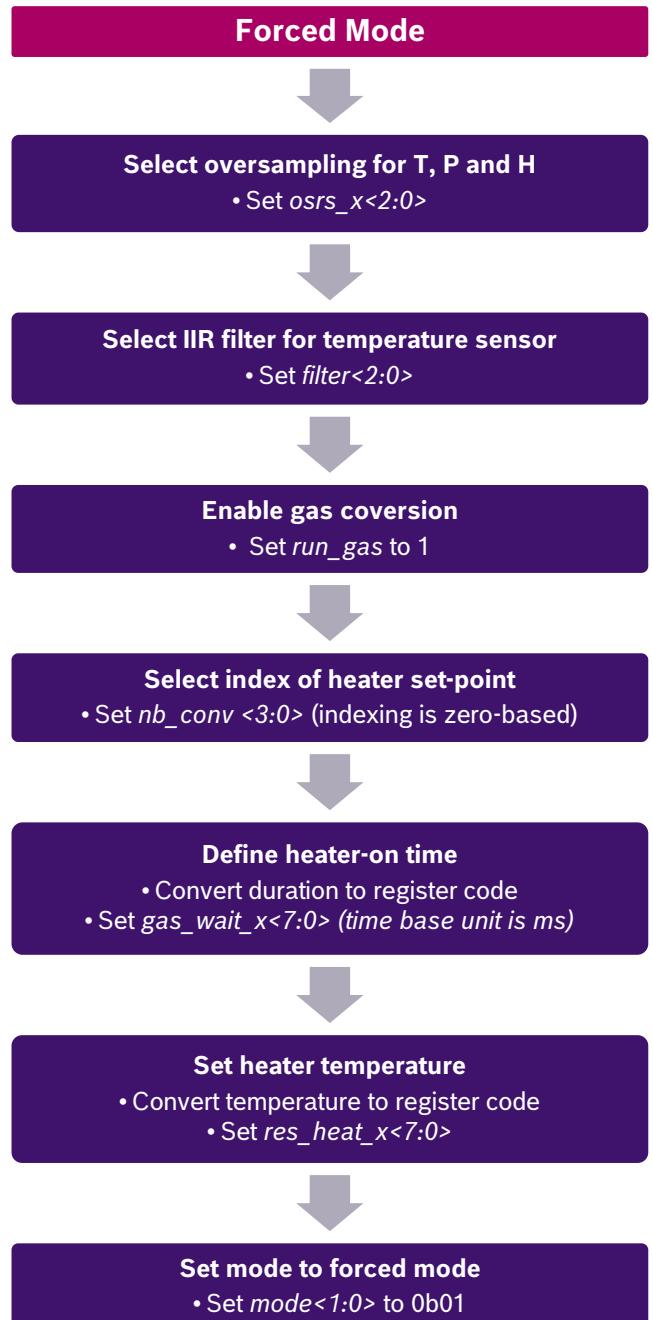
Picture 2: Sensor configuration flow
3.3 Measurement flow
Referring to Figure 1, the BME680 measurement period consists of a temperature, pressure and humidity measurement with selectable oversampling. Moreover, it contains a heating phase for the gas sensor hot plate as well as a measurement of the gas sensor resistance.
After the measurement period, the pressure and temperature data can be passed through an optional IIR filter, which removes short-term fluctuations. For humidity and gas, such a filter is not needed and has not been implemented.
3.3.1 Temperature measurement
Temperature measurement can be enabled or skipped. Skipping the measurement is typically not recommended since temperature information is used to compensate temperature influences in the other parameters. When enabled, severa oversampling options exist. The temperature measurement is controlled by the osrs_t<2:0> setting which is detailed in Section 5.3.2.2. For the temperature measurement, oversampling is possible to reduce the noise. The resolution of the temperature data depends on the IIR filter (see Section 5.3.2.4) and the oversampling setting:
• When the IIR filter is enabled, the temperature resolution is 20 bit
• When the IIR filter is disabled, the temperature resolution is 16 + (osrs_t – 1) bit, e.g. 18 bit when osrs_t is set to ‘3’
Using the variables listed in Table 11, the following code will calculate the compensated temperature value (in degrees Celsius). It is, however, recommended to use the sensor API available on github (Chapter 4) for a friendlier user experience.
Floating point:
var1 = (((double)temp_adc / 16384.0) - ((double)par_t1 / 1024.0)) * (double)par_t2;
var2 = (((double)temp_adc / 131072.0) - ((double)par_t1 / 8192.0)) *
    (((double)temp_adc / 131072.0) - ((double)par_t1 / 8192.0))) *
    ((double)par_t3 * 16.0);
t_fine = var1 + var2;
temp_comp = t_fine / 5120.0;
Integer:
var1 = ((int32_t)temp_adc >> 3) - ((int32_t)par_t1 << 1);
var2 = (var1 * (int32_t)par_t2) >> 11;
var3 = (((var1 >> 1) * (var1 >> 1)) >> 12) * ((int32_t)par_t3 << 4)) >> 14;
t_fine = var2 + var3;
temp_comp = ((t_fine * 5) + 128) >> 8;
where
• par_t1, par_t2 and par_t3 are calibration parameters,
• temp_adc is the raw temperature output data,
• temp_comp is the compensated temperature output data in degrees Celsius.
Table 11: Variable names and register addresses for temp_comp calculation
| Variable name | Register address (LSB / MSB) |
| par_t1 | 0xE9 / 0xEA |
| par_t2 | 0x8A / 0x8B |
| par_t3 | 0x8C |
| temp_adc | 0x24<7:4> / 0x23 / 0x22 |
3.3.2 Pressure measurement
Pressure measurement can be enabled or skipped. When enabled, several oversampling options exist. The pressure measurement is controlled by the osrs_p<2:0> setting which is detailed in Section 5.3.2. For the pressure measurement, oversampling is possible to reduce noise. The resolution of the pressure data depends on the IIR filter (see Section 5.3.2.4) and the oversampling setting:
• When the IIR filter is enabled, the pressure resolution is 20 bit
• When the IIR filter is disabled, the pressure resolution is 16 + (osrs_p – 1) bit, e.g. 18 bit when osrs_p is set to ‘3’
Using the variables listed in Table 12, the following code will calculate the compensated pressure value (in Pascal). It is, however, recommended to use the sensor API available on github (Chapter 4) for a friendlier user experience.
Floating point:
var1 = ((double)t_fine / 2.0) - 64000.0;
var2 = var1 * var1 * ((double)par_p6 / 131072.0);
var2 = var2 + (var1 * (double)par_p5 * 2.0);
var2 = (var2 / 4.0) + ((double)par_p4 * 65536.0);
var1 = (((double)par_p3 * var1 * var1) / 16384.0) +
((double)par_p2 * var1)) / 524288.0;
var1 = (1.0 + (var1 / 32768.0)) * (double)par_p1;
press_comp = 1048576.0 - (double)press_adc;
press_comp = ((press_comp - (var2 / 4096.0)) * 6250.0) / var1;
var1 = ((double)par_p9 * press_comp * press_comp) / 2147483648.0;
var2 = press_comp * ((double)par_p8 / 32768.0);
var3 = (press_comp / 256.0) * (press_comp / 256.0) *
(press_comp / 256.0) * (par_p10 / 131072.0);
press_comp = press_comp + (var1 + var2 + var3 +
((double)par_p7 * 128.0)) / 16.0;

Integer:
var1 = ((int32_t)t_fine >> 1) - 64000;
var2 = (((var1 >> 2) * (var1 >> 2)) >> 11) * (int32_t)par_p6) >> 2;
var2 = var2 + ((var1 * (int32_t)par_p5) << 1);
var2 = (var2 >> 2) + ((int32_t)par_p4 << 16);
var1 = (((((var1 >> 2) * (var1 >> 2)) >> 13) *
((int32_t)par_p3 << 5)) >> 3) + (((int32_t)par_p2 * var1) >> 1);
var1 = var1 >> 18;
var1 = ((32768 + var1) * (int32_t)par_p1) >> 15;
press_comp = 1048576 - press_raw;
press_comp = (uint32_t)((press_comp - (var2 >> 12)) * ((uint32_t)3125));
if (press_comp >= (1 << 30))
    press_comp = ((press_comp / (uint32_t)var1) << 1);
else
    press_comp = ((press_comp << 1) / (uint32_t)var1);
var1 = ((int32_t)par_p9 * (int32_t)((press_comp >> 3) * (press_comp >> 3)) >> 13)) >> 12;
var2 = ((int32_t)(press_comp >> 2) * (int32_t)par_p8) >> 13;
var3 = ((int32_t)(press_comp >> 8) * (int32_t)(press_comp >> 8) * (int32_t)(press_comp >> 8) * (int32_t)par_p10) >> 17;
press_comp = (int32_t)(press_comp) + ((var1 + var2 + var3 + ((int32_t)par_p7 << 7)) >> 4);
where
$p a r _ { - } p 1 , p a r _ { - } p 2 , . . . , p a r _ { - } p 1 0$ are calibration parameters,
• press_adc is the raw pressure output data,
• press_comp is the compensated pressure output data in Pascal.
Table 12: Variable names and register addresses for press_comp calculation
| Variable name | Register address (LSB / MSB) |
| par_p1 | 0x8E / 0x8F |
| par_p2 | 0x90 / 0x91 |
| par_p3 | 0x92 |
| par_p4 | 0x94 / 0x95 |
| par_p5 | 0x96 / 0x97 |
| par_p6 | 0x99 |
| par_p7 | 0x98 |
| par_p8 | 0x9C / 0x9D |
| par_p9 | 0x9E / 0x9F |
| par_p10 | 0xA0 |
| press_adc | 0x21<7:4> / 0x20 / 0x1F |
3.3.3 Humidity measurement
The humidity measurement can be enabled or skipped. When enabled, several oversampling options exist. The humidity measurement is controlled by the osrs_h<2:0> setting, which is described in detail in Section 5.3.2.1. For the humidity measurement, oversampling is possible to reduce noise. The resolution of the humidity measurement is fixed at 16 bit ADC output.
Using the variables listed in Table 13, the following code will calculate the compensated humidity value (in percent). It is, however, recommended to use the sensor API available on github (Chapter 4) for a friendlier user experience.
Floating point:
var1 = hum_adc - (((double)par_h1 * 16.0) + (((double)par_h3 / 2.0) * temp_comp));
var2 = var1 * (((double)par_h2 / 262144.0) * (1.0 + (((double)par_h4 / 16384.0) * temp_comp) + (((double)par_h5 / 1048576.0) * temp_comp * temp_comp)));
var3 = (double)par_h6 / 16384.0;
var4 = (double)par_h7 / 2097152.0;
hum_comp = var2 + ((var3 + (var4 * temp_comp)) * var2 * var2);

Integer:
temp_scaled = (int32_t)temp_comp;
var1 = (int32_t)hum_adc - (int32_t)((int32_t)par_h1 << 4) - ((temp_scaled * (int32_t)par_h3) / ((int32_t)100)) >> 1);
var2 = ((int32_t)par_h2 * (((temp_scaled * (int32_t)par_h4) / ((int32_t)100)) + ((temp_scaled * ((temp_scaled * (int32_t)par_h5) / ((int32_t)100))) >> 6) / ((int32_t)100)) + ((int32_t)(1 << 14)))) >> 10;
var3 = var1 * var2;
var4 = (((int32_t)par_h6 << 7) + ((temp_scaled * (int32_t)par_h7) / ((int32_t)100))) >> 4;
var5 = ((var3 >> 14) * (var3 >> 14)) >> 10;
var6 = (var4 * var5) >> 1;
hum_comp = (((var3 + var6) >> 10) * ((int32_t) 1000)) >> 12;
where
$p a r _ { - } h \mathscr { 1 } , p a r _ { - } h \mathscr { 2 } , . . . , p a r _ { - } h \mathscr { 7 }$ are calibration parameters,
• hum_adc is the raw humidity output data,
• hum_comp is the compensated humidity output data in percent.
Table 13: Variable names and register addresses for hum_comp calculation
| Variable name | Register address (LSB / MSB) |
| par_h1 | 0xE2<3:0> / 0xE3 |
| par_h2 | 0xE2<7:4> / 0xE1 |
| par_h3 | 0xE4 |
| par_h4 | 0xE5 |
| par_h5 | 0xE6 |
| par_h6 | 0xE7 |
| par_h7 | 0xE8 |
| hum_adc | 0x26 / 0x25 |
3.3.4 IIR filter
The environmental pressure is subject to many short-term changes, caused external disturbances. To suppress disturbances (e.g. slamming of door or wind blowing into the sensor) in the output data without causing additional interface traffic and processor work load, the BME680 features an internal IIR filter (see Section 5.3.2.4). It effectively reduces the bandwidth of the temperature and pressure output signals and increases the resolution of the output data to 20 bit, noting that the humidity and gas values inside the sensor does not fluctuate rapidly and does not require low pass filtering. The output of a next measurement step is filtered using the following formula:
$$
x _ {f i l t} [ n ] = \frac {x _ {f i l t} [ n - 1 ] \cdot (c - 1) + x _ {A D C}}{c}
$$
$x _ { f i l t } [ n - 1 ]$ is the data coming from the current filter memory, and $x _ { A D C }$ is the data coming from current ADC acquisition. $x _ { f i l t } [ n ]$ denotes the new value of filter memory and the value that will be sent to the output registers.
The IIR filter can be configured to different filter coefficients, which slows down the response to the sensor inputs. Note that the response time with enabled IIR filter depends on the number of samples generated, which means that the data output rate must be known to calculate the actual response time.
When writing to the register filter, the filter is reset. The next ADC values will pass through the filter unchanged and become the initial memory values for the filter. If temperature or pressure measurements are skipped, the corresponding filter memory will be kept unchanged even though the output registers are set to 0x80000. When the previously skipped measurement is re-enabled, the output will be filtered using the filter memory from the last time when the measurement was not skipped. If this is not desired, please write to the filter register in order to re-initialize the filter.
3.3.5 Gas sensor heating and measurement
The operation of the gas sensing part of BME680 involves two steps:
Heating the gas sensor hot plate to a target temperature (typically between $2 0 0 ~ ^ { \circ } \mathsf C$ and $4 0 0 ~ ^ { \circ } \mathrm { C } )$ and keep that temperature for a certain duration of time.
Measuring the resistance of the gas sensitive layer.
Up to 10 different hot plate temperature set points can be configured by setting the registers res_heat $. x { < } 7 { : } 0 >$ , where $\textsf { x } =$ 0…9 .The internal heater control loop operates on the resistance of the heater structure. Hence, the user first needs to convert the target temperature into a device specific target resistance before writing the resulting register code into the sensor memory map.
Using the variables listed Table 14: Variable names and register addresses for res_heat_x calculation, the following code will calculate register code that to be written to res_heat_ $x { < } 7 { : } 0 >$ . It is, however, recommended to use the sensor AP available on github (Chapter 4) for a friendlier user experience.
Floating point:
var1 = ((double)par_g1 / 16.0) + 49.0;
var2 = (((double)par_g2 / 32768.0) * 0.0005) + 0.00235;
var3 = (double)par_g3 / 1024.0;
var4 = var1 * (1.0 + (var2 * (double) target_temp));
var5 = var4 + (var3 * (double)amb_temp);
res_heat_x = (uint8_t)(3.4 * ((var5 * (4.0 / (4.0 + (double)res_heat_range)) * (1.0/(1.0 + ((double)res_heat_val * 0.002)))) - 25));
Integer:
var1 = (((int32_t)amb_temp * par_g3) / 10) << 8;
var2 = (par_g1 + 784) * (((((par_g2 + 154009) * target_temp * 5) / 100) + 3276800) / 10);
var3 = var1 + (var2 >> 1);
var4 = (var3 / (res_heat_range + 4));
var5 = (131 * res_heat_val) + 65536;
res_heat_x100 = (int32_t)(((var4 / var5) - 250) * 34);
res_heat_x = (uint8_t)((res_heat_x100 + 50) / 100);
where
$p a r _ { - } g 1 , p a r _ { - } g 2$ , and $p a r _ g 3$ are calibration parameters,
• target_temp is the target heater temperature in degree Celsius,
• amb_temp is the ambient temperature (hardcoded or read from temperature sensor),
• var5 is the target heater resistance in Ohm,
• res_heat_x is the decimal value that needs to be stored in register, where ‘x’ corresponds to the temperature profile number between 0 and 9,
• res_heat_range is the heater range stored in register address 0x02 <5:4>, and • res_heat_val is the heater resistance correction factor stored in register address 0x00 (signed, value from -128 to 127).
Table 14: Variable names and register addresses for res_heat_x calculation
| Variable name | Register address (LSB / MSB) |
| par_g1 | 0xED |
| par_g2 | 0xEB/0xEC |
| par_g3 | 0xEE |
| res_heat_range | 0x02 <5:4> |
| res_heat_val | 0x00 |
For each of the 10 temperature set-points, the heating duration must be specified. Referring to Figure 1, the heating phase starts after the temperature, pressure and humidity measurements are complete. This means there is no heating in parallel to these measurements, which is desirable to minimize undesired cross-influences between the various sensor components.
The heating duration is specified by writing to the corresponding gas_wait_x<7:0> control register. Heating durations between 1 ms and 4032 ms can be configured. In practice, approximately 20–30 ms are necessary for the heater to reach the intended target temperature.
3.4 Data readout
The procedure goes as follows, the new_data_x bit (see Section 5.3.5.1) can be checked to see if a new data is generated. If gas measurements are performed the gas_valid_r (see Section 5.3.5.5) and heat_stab_r (see Section 5.3.5.6) status bits of the respectively field should be checked to ensure that the gas measurement was successful. If heat_stab_r is zero, it indicates that either the heating time was not sufficient to allow the sensor to reach to configured target temperature or that the target temperature was too high for the sensor to reach.
After the uncompensated values of temperature, pressure and humidity have been read, the actual humidity, pressure and temperature need to be calculated using the compensation parameters stored in the device. Please refer to the BME6xy AP for more details.
3.4.1 Gas sensor resistance readout
Readout of gas sensor resistance ADC value and calculation of gas sensor resistance consists of 3 steps
Read gas ADC value (gas_adc) and gas ADC range (gas_range) (see Section 5.3.4)
Read range switching error from register address 0x04 <7:4> (signed 4 bit)
Convert ADC value into gas sensor resistance in ohm
Using the variables listed in Table 15 and Table 16, the conversion is done as follows:
Floating point:
var1 = (1340.0 + 5.0 * range_switching_error) * const_array1[gas_range];
gas_res = var1 * const_array2[gas_range] / (gas_adc - 512.0 + var1);
Integer:
((int64_t)const_array1_int[gas_range])) >> 16);
$$
\text { int64_t var2 } = (\text { int64_t }) (\text { gas_adc } < < 1 5) - (\text { int64_t }) (1 < < 2 4) + \text { var1 };
$$
$$
\begin{array}{l} \text {int32_t gas_res = (int32_t)((((int64_t)(const_array2_int[gas_range] * (int64_t)var1) >> 9) + (var2 >>} \ \text {1)) / var2);} \end{array}
$$
where
• gas_adc is the raw gas sensor resistance output data (i.e. ADC value),
• gas_range is the ADC range of the measured gas sensor resistance,
• range_switching_error is a calibration parameter,
• gas_res is the compensated gas sensor resistance output data in Ohms.
Table 15: Variable names and register addresses for gas_res calculation
| Variable name | Register address (LSB / MSB) |
| gas_adc | 0x2B<7:6> / 0x2A |
| gas_range | 0x2B<3:0> |
| range_switching_error | 0x04 |
Table 16: List of gas ranges and corresponding constants used for the resistance calculation
| gas_range_r | Constants to be integrated into the driver | |||
| Floating point | Integer | |||
| const_array1 | const_array2 | const_array1_int | const_array2_int | |
| 0 | 1 | 8000000 | 2147483647 | 4096000000 |
| 1 | 1 | 4000000 | 2147483647 | 2048000000 |
| 2 | 1 | 2000000 | 2147483647 | 1024000000 |
| 3 | 1 | 1000000 | 2147483647 | 512000000 |
| 4 | 1 | 499500.4995 | 2147483647 | 255744255 |
| 5 | 0.99 | 248262.1648 | 2126008810 | 127110228 |
| 6 | 1 | 125000 | 2147483647 | 64000000 |
| 7 | 0.992 | 63004.03226 | 2130303777 | 32258064 |
| 8 | 1 | 31281.28128 | 2147483647 | 16016016 |
| 9 | 1 | 15625 | 2147483647 | 8000000 |
| 10 | 0.998 | 7812.5 | 2143188679 | 4000000 |
| 11 | 0.995 | 3906.25 | 2136746228 | 2000000 |
| 12 | 1 | 1953.125 | 2147483647 | 1000000 |
| 13 | 0.99 | 976.5625 | 2126008810 | 500000 |
| 14 | 1 | 488.28125 | 2147483647 | 250000 |
| 15 | 1 | 244.140625 | 2147483647 | 125000 |
4. Software and use cases
4.1 BSEC software
BME680 sensor is intended to be used together with Bosch Software Environmental Cluster (BSEC) solution and BME6xy sensor API to unlock its full potential. The BSEC software features intelligent algorithms which enable use cases such as indoor-air-quality monitoring using the BME680.
Bosch Sensortec BSEC software is available as a closed source binary which will be made available via a Software License Agreement (SLA) on the Bosch Sensortec website (https://www.bosch-sensortec.com/bst/products/all\_products/BSEC). Sensor API covers basic sensor communication and data compensation functions and is available as open-source code from Github (https://github.com/BoschSensortec/BME68x-Sensor-API).
The key features of the hardware-software system are:
• Calculation of ambient air temperature outside of the device (e.g. phone)
• Calculation of ambient relative humidity outside of the device
• Calculation of index for air quality (IAQ) level outside of the device
Moreover, the software algorithms handle humidity compensation, baseline as well as long-term drift correction of the gas sensor signal.
Different power modes for the gas sensor and corresponding data rates are supported by the software solution:
Ultra low power (ULP) mode is designed for battery-powered and/or frequency-coupled devices over extended periods of time. This mode features an update rate of 300 seconds and an average current consumption of <0.1 mA Quick Ultra-low power (q-ULP) has a 3 s data rate for Temperature, pressure and humidity w/o significantly increasing the power consumption compared to ULP.
• Low power (LP) mode that is designed for interactive applications where the air quality is tracked and observed at a higher update rate of 3 seconds with a current consumption of <1 mA
• Continuous (CONT) mode provides an update rate of 1 Hz and shall only be used short-term for use cases that incorporate very fast events or stimulus.
Table 17: BSEC gas sensor power-modes
| BSEC power mode | Update rate | Average current consumption |
| Ultra-low power mode (ULP) | 3.3 mHz | 0.09 mA |
| quick Ultra-low power mode (q-ULP) | 0.33 Hz (T, p, h) / 3.3 mHz (IAQ) | 0.1 mA |
| Low power mode (LP) | 0.33 Hz | 0.9 mA |
| Continuous mode (for testing purposes only) | 1 Hz | 12 mA |
The BSEC software suite can be downloaded from the Bosch Sensortec website:
https://www.bosch-sensortec.com/bst/products/all\_products/BSEC
The following table describes the available outputs of BSEC. Full descriptions of the outputs and the available interfaces are available in the integration guide shipped together with the BSEC software.
Table 18: BSEC outputs
| Output | Description |
| Raw pressure | Raw data from sensor API bypassed to BSEC output |
| Raw temperature | Raw data from sensor API bypassed to BSEC output |
| Raw relative humidity | Raw data from sensor API bypassed to BSEC output |
| Raw gas sensor resistance | Raw data from sensor API bypassed to BSEC output |
| Sensor-compensated temperature (°C) | Temperature which is compensated for internal cross-influences caused by the BME sensor |
| Sensor-compensated relative humidity (%) | Relative humidity which is compensated for internal cross-influences caused by the BME sensor |
| Sensor-compensated gas sensor resistance (Ohm) | Raw gas sensor resistance compensated by temperature and humidity influences. |
| IAQ (0-500) | Index for Air Quality, especially recommended for mobile devices, since the auto-trim algorithm automatically adopts to different environments. |
| Static IAQ (“s-IAQ”) | “Static” Index for Air Quality, especially recommended for stationary devices (w/o auto-trimming algorithm) |
| CO2 equivalents (ppm) | Estimation of the CO2 level in ppm. The sensor does not directly measure CO2, but derives this from the average correlation between VOCs and CO2 in human's exhaled breath. |
| b-VOC equivalents (ppm) | Conversion into breath-VOC equivalents in ppm concentration. The scaling is derived from lab tests with the b-VOC gas mixture described in Table 5. |
| Accuracy status (0-3) | Accuracy status of IAQ |
| Stabilization time status | Indicates if the sensor is undergoing initial stabilization during its first use after production |
| Run in status | Indicates when the sensor is ready after switch-on |
| Gas (%) | Alternative indicator for air pollution which rates the current raw gas sensor resistance value based on the individual sensor history:0% = “lowest air pollution ever measured”100% = “highest air pollution level ever measured” |
4.2 Indoor air quality
The BME680 is a metal oxide-based sensor that detects VOCs by adsorption (and subsequent oxidation/reduction) on its sensitive layer. Thus, the BME680 reacts to most volatile organic compounds as well as many other gases polluting indoor air (one exception is for instance CO2). In contrast to sensors which are selective for one specific component, the BME680 is capable of measuring the sum of nearly all VOCs/contaminants in the surrounding air. This enables the BME680 to detect e.g. outgassing from paint, furniture and/or garbage, high VOC levels due to cooking, food consumption, exhaled breath and/or sweating.
As a raw signal, the BME680 will output gas sensor resistance values and its changes due to varying gas concentrations (the higher the concentration of reducing VOCs, the lower the resistance and vice versa). Since this raw signal is influenced as well by parameters other than VOC concentration (e.g. humidity level), the raw values are transformed to an index for air quality (IAQ) by smart algorithms inside BSEC.
The IAQ scale ranges from 0 (clean air) to 500 (heavily polluted air). During operation, the algorithms automatically calibrate and adapt themselves to the typical environments where the sensor is operated (e.g., home, workplace, inside a car, etc.). This automatic background calibration ensures that users experience consistent IAQ performance. The calibration process considers the recent measurement history (typ. up to four days, adjustable by BSEC config string) to ensure that IAQ ~ 50 corresponds to “typical good” air and IAQ ~ 200 indicates “typical polluted” air.
5. Global memory map and register description
5.1 General remarks
Communication with the device is performed by reading from and writing to registers. Registers have a width of 8 bits. If I2C is used, 8-bit addressing is utilized. If SPI is used, 7-bit address is only available for register access. For details on the interface, consult Chapter 6.
In SPI mode complete memory map is accessed using page 0 and page 1. Register spi_mem_page is used for page selection. After power-on, spi_mem_page is in its reset state and page 0 (0x80 to 0xFF) will be active. Page 1 (0x00 to 0x7F) will be active on setting spi_mem_page to 1.
Global memory map consists of calibration registers, control registers, data registers, status registers and reserved registers. There are, however, several registers which are reserved. Accordingly, they should not be written to and no specific value is guaranteed when they are read.
Table 19: Memory map page selection
| Digital Interface | Register address range | Register spi_mem_page | Memory Page |
| I2C | 0x00 to 0xFF | Not Applicable | Not Applicable |
| SPI | 0x80 to 0xFF | 0 (default; power on state) | Page 0 |
| SPI | 0x00 to 0x7F | 1 | Page 1 |
5.2 Memory map
The memory map is given in Table 20, noting that not all reserved registers are depicted.
Table 20: Memory map
| Register name | I2C | SPI | Bit 7 | Bit 6 | Bit 5 | Bit 4 | Bit 3 | Bit2 | Bit 1 | Bit 0 | Reset state | |
| Adr | Adr | Pg | ||||||||||
| status | 73h | 73h | 1 | spi_mem_page | 00h | |||||||
| Reset | E0h | 60h | 0 | reset<7:0> | 00h | |||||||
| Id | D0h | 50h | 0 | chip_id<7:0> | 61h | |||||||
| Config | 75h | 75h | 1 | filter<2:0> | spi_3w_en | 00h | ||||||
| Ctrl_meas | 74h | 74h | 1 | osrs_t<2:0> | osrs_p<2:0> | mode<1:0> | 00h | |||||
| Ctrl_hum | 72h | 72h | 1 | spi_3w_int_en | osrs_h<2:0> | 00h | ||||||
| Ctrl_gas_1 | 71h | 71h | 1 | run_gas | nb_conv<3:0> | 00h | ||||||
| Ctrl_gas_0 | 70h | 70h | 1 | heat_off | 00h | |||||||
| Gas_wait_x | 6Dh...64h | 6Dh...64h | 1 | gas_wait_9<7:0> downto gas_wait_0<7:0> | 00h | |||||||
| Res_heat_x | 63h...5Ah | 63h...5Ah | 1 | res_heat_9<7:0> downto res_heat_0<7:0> | 00h | |||||||
| Idac_heat_x | 59h...50h | 59h...50h | 1 | idac_heat_9<7:0> downto idac_heat_0<7:0> | 00h | |||||||
| gas_r_lsb | 2Bh | 2Bh | 1 | gas_r<1:0> | gas_valid_r | heat_stab_r | gas_range_r | 00h | ||||
| gas_r_msb | 2Ah | 2Ah | 1 | gas_r<9:2> | 00h | |||||||
| hum_lsb | 26h | 26h | 1 | hum_lsb<7:0> | 00h | |||||||
| hum_msb | 25h | 25h | 1 | hum_msb<7:0> | 80h | |||||||
| temp_xlsb | 24h | 24h | 1 | temp_xlsb<7:4> | 0 | 0 | 0 | 0 | 00h | |||
| temp_lsb | 23h | 23h | 1 | temp_lsb<7:0> | 00h | |||||||
| temp_msb | 22h | 22h | 1 | temp_msb<7:0> | 80h | |||||||
| press_xlsb | 21h | 21h | 1 | press_xlsb<7:4> | 0 | 0 | 0 | 0 | 00h | |||
| press_lsb | 20h | 20h | 1 | press_lsb<7:0> | 00h | |||||||
| press_msb | 1Fh | 1Fh | 1 | press_msb<7:0> | 80h | |||||||
| eas_status_0 | 1Dh | 1Dh | 1 | new_data_0 | gas_measuring | measuring | gas_meas_index_0<3:0> | 00h | ||||
| Registers | Color/Type |
| Reserved | Do not change |
| Status register | Read only |
| Data register | Read only |
| Control register | Read/write |
5.3 Register description
5.3.1 General control registers
5.3.1.1 SPI 3 wire interrupt enable – spi_3w_int_en
| Register Name | Address | Content | Description |
| ctrl_hum | 0x72 | spi_3w_int_en <6> | New data interrupt can be enabled if the device is in SPI 3 wire mode and pi_3w_int_en=1.The new data interrupt is then indicated on the SDO pad. |
5.3.1.2 SPI 3 wire enable – spi_3w_en
| Register Name | Address | Content | Description |
| config | 0x75 | spi_3w_en<0> | Enable SPI 3 wire mode |
5.3.1.3 Mode Selection – mode
The operation modes of the sensor can be controlled by the register mode as specified below.
| Register Name | Address | Content | Description |
| ctrl_meas | 0x74 | mode<1:0> | Select sensor power mode as shown in the following table |
| mode<1:0> | Mode | ||
| 00 | Sleep mode | ||
| 01 | Forced mode | ||
5.3.1.4 SPI memory map page selection – spi_mem_page
In SPI mode complete memory page is accessed using page 0 & page 1. Register spi_mem_page is used for page selection. After power-on, spi_mem_page is in its reset state and page 0(0x80 to 0xFF) will be active. Page1 (0x00 to 0x7F) will be active on setting spi_mem_page. Please refer Table 19 for better understanding.
| Register Name | Address | Content | Description |
| status | 0x73(Page 0/1) | spi_mem_page <4> | Selects memory map page in SPI mode |
5.3.1.5 Reset – reset
Writing 0xB6 to this register initiates a soft-reset procedure, which has the same effect like power-on reset. The default value stored in this register is 0x00.
| Register Name | Address | Content | Description |
| reset | 0x60 (Page 0 in SPI mode)0xE0 in I2C | reset<7:0> | Resets the device |
5.3.1.6 Chip id – chip_id
| Register Name | Address | Content | Description |
| Id | 0x50(Page 0 in SPI mode)0xD0 in I2C | chip_id<7:0> | Chip id of the device |
5.3.2 Temperature, pressure and relative humidity control registers
5.3.2.1 Humidity sensor over sampling control – osrs_h
| Register Name | Address | Content | Description |
| ctrl_hum | 0x72 | osrs_h<2:0> | Controls over sampling setting of humidity sensor as described in the following table |
| osrs_h<2:0> | Humidity oversampling |
| 000 | Skipped (output set to 0x8000) |
| 001 | oversampling ×1 |
| 010 | oversampling ×2 |
| 011 | oversampling ×4 |
| 100 | oversampling ×8 |
| 101, Others | oversampling ×16 |
5.3.2.2 Over sampling setting – Temperature data – osrs_t
| Register Name | Address | Content | Description |
| ctrl_meas | 0x74 | osrs_t<7:5> | Temperature oversampling settings as shown in the following table |
| osrs_t<2:0> | Temperature oversampling |
| 000 | Skipped (output set to 0x8000) |
| 001 | oversampling ×1 |
| 010 | oversampling ×2 |
| 011 | oversampling ×4 |
| 100 | oversampling ×8 |
| 101, Others | oversampling ×16 |
5.3.2.3 Over sampling setting – Pressure data – osrs_p
| Register Name | Address | Content | Description |
| ctrl_meas | 0x74 | osrs_p<4:2> | Pressure oversampling settings as shown in the following table |
| osrs_p<2:0> | Pressure oversampling | ||
| 000 | Skipped (output set to 0x8000) | ||
| 001 | oversampling ×1 | ||
| 010 | oversampling ×2 | ||
| 011 | oversampling ×4 | ||
| 100 | oversampling ×8 | ||
| 101, Others | oversampling ×16 | ||
5.3.2.4 IIR filter control – filter
IIR filter applies to temperature and pressure data but not to humidity and gas data. The data coming from the ADC are filtered and then loaded into the data registers. The temperature and pressure result registers are updated together at the same time at the end of the measurement. IIR filter output resolution is 20 bits. The result registers are reset to value 0x80000 when the temperature and/or pressure measurements have been skipped (osrs_x=”000‟). The appropriate filter memory is kept unchanged (the value from the last measurement is kept). When the appropriate OSRS register is set back to nonzero, then the first value stored to the result registers are filtered.
| Register Name | Address | Content | Description |
| config | 0x75 | filter<4:2> | IIR filter settings as shown in the following table |
| filter<2:0> | Filter coefficient | ||
| 000 | 0 | ||
| 001 | 1 | ||
| 010 | 3 | ||
| 011 | 7 | ||
| 100 | 15 | ||
| 101 | 31 | ||
| 110 | 63 | ||
| 111 | 127 | ||
5.3.3 Gas control registers
The sensor can have 10 programmable gas sensor heater set-points. A set-point consists of a target heater resistance, heater-on time and optionally an initial heater current.
5.3.3.1 Heater current - idac_heat_x
BME680 contains a heater control block that will inject enough current into the heater resistance to achieve the requested heater temperature. There is a control loop which periodically measures heater resistance value and adapts the value of current injected from a DAC.
The heater operation could be speeded up by setting an initial heater current for a target heater temperature by using register idac_heat_x<7:0>. This step is optional since the control loop will find the current after a few iterations anyway. The current injected to the heater in mA can be calculated by: (idac_heat_7_1 + 1) / 8, where idac_heat_7_1 is the decimal value stored in idac_heat<7:1> (unsigned, value from 0 to 127).
| Heater set-point | Register name | Address | Content | Description |
| 0...9 | idac_heat_xx is from 0 to 9 | 0x50...0x59 | idac_heat_x<7:0>x is from 0 to 9 | idac_heat of particular heater set point |
5.3.3.2 Target heater resistance - res_heat_x
Target heater resistance is programmed by user through res_heat_x<7:0> registers. The definition of res_heat_x is given in Section 3.3.5.
| Heater set-point | Register name | Address | Content | Description |
| 0...9 | res_wait_xx is from 0 to 9 | 0x5A...0x63 | res_heat_x<7:0>x is from 0 to 9 | Decimal value that needs to be stored for achieving target heater resistance |
5.3.3.3 Gas Sensor wait time - gas_wait_x
Referring to Figure 1, the time between the beginning of the heat phase and the start of gas sensor resistance conversion depends on gas_wait_x setting as mentioned below.
| Heater set-point | Register name | Address | Content | Description |
| 0...9 | gas_wait_xx is from 0 to 9 | 0x64...0x6D | gas_wait_x<5:0>x is from 0 to 9 | 64 timer values with1 ms step sizes, all zeros means no wait |
| 0...9 | gas_wait_xx is from 0 to 9 | 0x64...0x6D | gas_wait_x<7:6>x is from 0 to 9 | Please refer to the table below for settings |
| gas_wait_x<7:6> | Gas sensor wait time multiplication factor |
| 00 | 1 |
| 01 | 4 |
| 10 | 16 |
| 11 | 64 |
5.3.3.4 Heater off - heat_off
| Register Name | Address | Content | Description |
| ctrl_gas_0 | 0x70 | heat_off <3> | Turn off current injected to heater by setting bit to one |
5.3.3.5 Heater profile selection - nb_conv
nb_conv is used to select heater set-points of the sensor. The different heater set-points are described in the sections above.
| Register Name | Address | Content | Description |
| ctrl_gas_1 | 0x71 | nb_conv<3:0> | Indicates index of heater set point that will be used in forced mode as describe in below table |
| nb_conv<3:0> | Heater profile set-point | ||
| 0000 | 0 | ||
| 0001 | 1 | ||
| 0010 | 2 | ||
| 0011 | 3 | ||
| 0100 | 4 | ||
| 0101 | 5 | ||
| 0110 | 6 | ||
| 0111 | 7 | ||
| 1000 | 8 | ||
| 1001 | 9 | ||
5.3.3.6 Run Gas - run_gas
| Register Name | Address | Content | Description |
| ctrl_gas_1 | 0x71 | run_gas<4> | The gas conversions are started only in appropriate mode if run_gas = ‘1’ |
5.3.4 Data registers
In this section, the data registers for the temperature, pressure, humidity and gas sensors are explained. Shadowing registers are utilized to buffer the data and to ensure stable data in case an update of the data registers occurs simultaneously with the serial interface reading out.
5.3.4.1 Pressure data
| Register Name | Address | Content | Description |
| press_msb | 0x1F | press_msb<7:0> | Contains the MSB part [19:12] of the raw pressure measurement output data. |
| press_lsb | 0x20 | press_lsb<7:0> | Contains the LSB part [11:4] of the raw pressure measurement output data |
| press_xlsb | 0x21 | press_xlsb<7:4> | Contains the XLSB part [3:0] of the raw pressure measurement output data. Contents depend on pressure resolution controlled by oversampling setting. |
5.3.4.2 Temp data
| Register Name | Address | Content | Description |
| temp_msb | 0x22 | temp_msb<7:0> | Contains the MSB part [19:12] of the raw temperature measurement output data. |
| temp_lsb | 0x23 | temp_lsb<7:0> | Contains the LSB part [11:4] of the raw temperature measurement output data. |
| temp_xlsb | 0x24 | temp_xlsb<7:4> | Contains the XLSB part [3:0] of the raw temperature measurement output data. Contents depend on temperature resolution controlled by oversampling setting. |
5.3.4.3 Humidity data
| Register Name | Address | Content | Description |
| hum_msb | 0x25 | hum_msb<7:0> | Contains the MSB part [15:8] of the raw humidity measurement output data. |
| hum_lsb | 0x26 | hum_lsb<7:0> | Contains the LSB part [7:0] of the raw humidity measurement output data. |
5.3.4.4 Gas sensor resistance data
| Register Name | Address | Content | Description |
| gas_r_msb | 0x2A | gas_r<7:0> | Contains the MSB part gas sensor resistance [9:2] of the raw gas sensor resistance. |
| gas_r_lsb | 0x2B | gas_r<7:6> | Contains the LSB part gas sensor resistance [1:0] of the raw gas sensor resistance. |
5.3.4.5 Gas sensor resistance range
| Register Name | Address | Content | Description |
| gas_r_lsb | 0x2B | gas_range_r<3:0> | Contains ADC range of measured gas sensor resistance. |
5.3.5 Status registers
5.3.5.1 New data status
The measured data are stored into the output data registers at the end of each TPHG conversion phase along with status flags and index of measurement.
| Register Name | Address | Content | Description |
| meas_status_0 | 0x1D | new_data_0<7> | New data flag |
5.3.5.2 Gas measuring status
Measuring bit is set to “1‟ only during gas measurements, goes to “0‟ as soon as measurement is completed and data transferred to data registers. The registers storing the configuration values for the measurement (gas_wait_shared, gas_wait_x, res_heat_x, idac_heat_x, image registers) should not be changed when the device is measuring.
| Register Name | Address | Content | Description |
| meas_status_0 | 0x1D | gas_measuring<6> | Gas measuring status flag |
5.3.5.3 Measuring status
Measuring status will be set to ‘1’ whenever a conversion (temperature, pressure, humidity and gas) is running and back to ‘0’ when the results have been transferred to the data registers.
| Register Name | Address | Content | Description |
| meas_status_0 | 0x1D | measuring<5> | Measuring status flag |
5.3.5.4 Gas Measurement Index
User can program a sequence of up to 10 conversions by setting nb_conv<3:0>. Each conversion has its own heater resistance target but 3 field registers to store conversion results. The actual gas conversion number in the measurement sequence (up to 10 conversions numbered from 0 to 9) is stored in gas_meas_index register.
| Register Name | Address | Content | Description |
| meas_status_0 | 0x1D | gas_meas_index_0<3:0> | Gas measurement index |
5.3.5.5 Gas valid status
In each TPHG sequence contains a gas measurement slot, either a real one which result is used or a dummy one to keep a constant sampling rate and predictable device timing. A real gas conversion (i.e., not a dummy one) is indicated by the gas_valid_r status register.
| Register Name | Address | Content | Description |
| gas_r_lsb | 0x2B | gas_valid_r<5> | Gas valid bit |
5.3.5.6 Heater Stability Status
Heater temperature stability for target heater resistance is indicated heat_stab_x status bits.
| Register Name | Address | Content | Description |
| gas_r_lsb | 0x2B | heat_stab_r<4> | Heater stability bit |
6. Digital interfaces
The sensor supports the I²C and SPI digital interfaces, where it acts as a slave for both protocols. The I²C interface supports the Standard, Fast and High Speed modes. The SPI interface supports both SPI mode ‘00’ (CPOL = CPHA = ‘0’) and mode ‘11’ (CPOL = CPHA = ‘1’) in 4-wire and 3-wire configuration.
The following transactions are supported:
• Single byte write
• multiple byte write (using pairs of register addresses and register data)
• single byte read
• multiple byte read (using a single register address which is auto-incremented)
6.1 Interface selection
Interface selection is done automatically based on CSB (chip select) status. If CSB is connected to V , the I²C interface is active. If CSB is pulled down, the SPI interface is activated. After CSB has been pulled down once (regardless of whether any clock cycle occurred), the I²C interface is disabled until the next power-on-reset. This is done in order to avoid inadvertently decoding SPI traffic to another slave as I²C data. Since the device startup is deferred until both VDD and VDDIO are established, there is no risk of incorrect protocol detection because of the power-up sequence used. However, if I²C is to be used and CSB is not directly connected to VDDIO but is instead connected to a programmable pin, it must be ensured that this pin already outputs the VDDIO level during power-on-reset of the device. If this is not the case, the device will be locked in SPI mode and not respond to I²C commands.
6.2 I²C Interface
For detailed timings, please review Table 22 . All modes (standard, fast, high speed) are supported. SDA and SCL are not pure open-drain. Both pads contain ESD protection diodes to VDDIO and GND. As the devices does not perform clock stretching, the SCL structure is a high-Z input without drain capability.
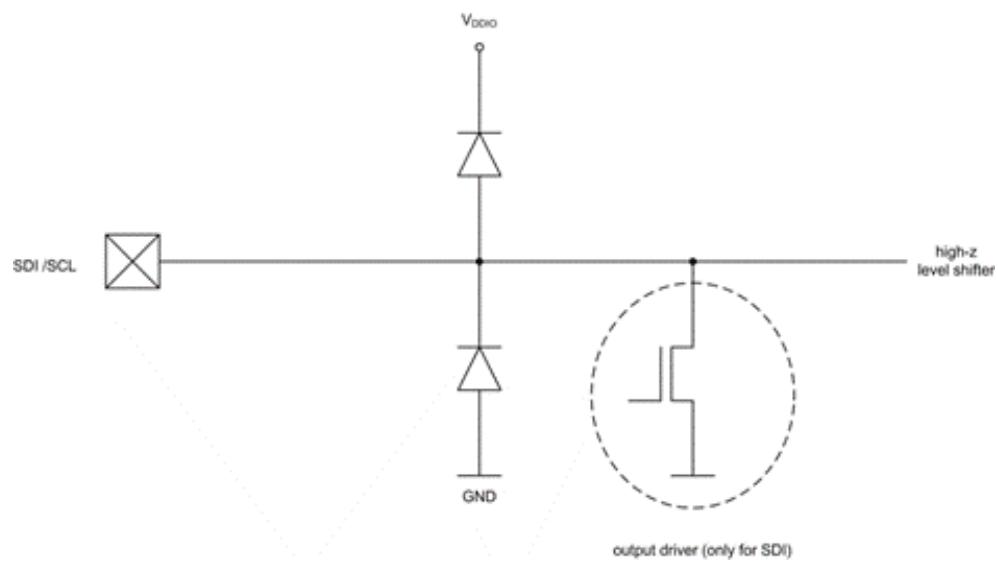
Picture 3: SDI/SCK ESD schematic
The 7-bit device address is 111011x. The 6 MSB bits are fixed. The last bit is changeable by SDO value and can be changed during operation. Connecting SDO to GND results in slave address 1110110 (0x76); connection it to V results in slave address 1110111 (0x77), which is the same as BMP280’s I²C address. The SDO pin cannot be left floating; if left floating, the I²C address will be undefined.
The I²C interface uses the following pins:
• SCK: serial clock (SCL)
• SDI: data (SDA)
• SDO: Slave address LSB (GND = ‘0’, VDDIO = ‘1’)
CSB must be connected to V to select I²C interface. SDI is bi-directional with open drain to GND: it must be externally connected to VDDIO via a pull up resistor. Refer to Chapter 7 for connection instructions.
The following abbreviations will be used in the I²C protocol figures:
S Start
P Stop
• ACKS Acknowledge by slave
• ACKM Acknowledge by master
NACKM Not acknowledge by master
6.2.1 I²C write
Writing is done by sending the slave address in write mode (RW = ‘0’), resulting in slave address 111011X0 (‘X’ is determined by state of SDO pin. Then the master sends pairs of register addresses and register data. The transaction is ended by a stop condition. This is depicted in Picture 4.
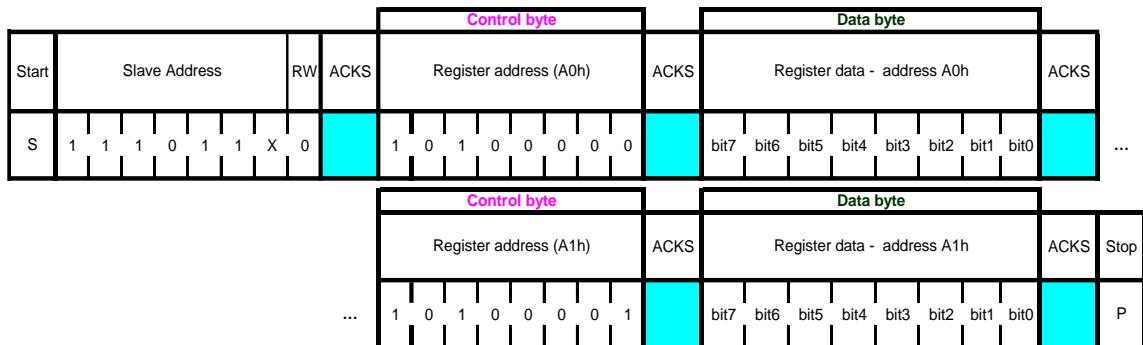
Picture 4: I²C multiple byte write (not auto-incremented)
6.2.2 I²C read
To be able to read registers, first the register address must be sent in write mode (slave address 111011X0). Then either a stop or a repeated start condition must be generated. After this the slave is addressed in read mode (RW = ‘1’) at address 111011X1, after which the slave sends out data from auto-incremented register addresses until a NOACKM and stop condition occurs. This is depicted in Picture 5, where register 0xF6 and 0xF7 are read.

Picture 5: I²C multiple byte read
6.3 SPI interface
The SPI interface is compatible with SPI mode $^ { \circ } 0 0 ^ { \circ } \left( \mathsf { C P O L } = \mathsf { C P H A } = ^ { \circ } 0 ^ { \circ } \right)$ and mode $\cdot 1 1 ^ { \circ } ( \mathsf { C P O L } = \mathsf { C P H A } = ^ { \circ } 1 ^ { \circ } )$ . The automatic selection between mode ‘00’ and ‘11’ is determined by the value of SCK after the CSB falling edge.
The SPI interface has two modes, namely 4-wire and 3-wire mode. However, the protocol is the same for both. The 3-wire mode is selected by setting ‘1’ to the register spi3w_en. The pad SDI is used as a data pad in 3-wire mode.
The SPI interface uses the following pins:
• CSB: chip select, active low
• SCK: serial clock
• SDI: serial data input; data input/output in 3-wire mode
• SDO: serial data output; hi-Z in 3-wire mode
For more connection instructions, please refer to Chapter 7.
CSB is active low and has an integrated pull-up resistor. Data on SDI is latched by the device at SCK rising edge and SDO is changed at SCK falling edge. Communication starts when CSB goes to low and stops when CSB goes to high; during these transitions on CSB, SCK must be stable. The SPI protocol is shown in It is important to note that Picture 6. For timing details, please review Table 23.
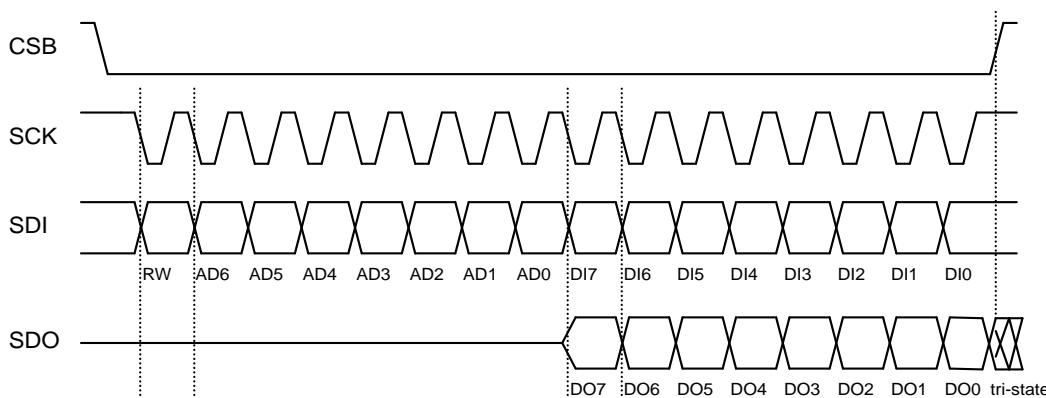
Picture 6: SPI protocol (shown for mode ‘11’ in 4-wire configuration)
It is important to note that in the SPI mode, only 7 bits of the register addresses are used; the MSB of register address is not used and replaced by a read/write bit (RW = ‘0’ for write and RW = ‘1’ for read). For example, address 0xF7 is accessed by using SPI register address 0x77. On the one hand, the byte 0x77 is transferred for write access, and on the other hand, the byte 0xF7 is transferred for read access.
6.3.1 SPI write
Writing is done by lowering CSB and sending pairs control bytes and register data. The control bytes consist of the SPI register address (= full register address without bit 7) and the write command (bit7 $\mathbf { \sigma } ^ { \prime } = \mathsf { R W } = \mathbf { \sigma } ^ { \prime } 0 ^ { \prime } )$ . Several pairs can be written without raising CSB. The transaction is ended by a raising CSB. The SPI write protocol is depicted in Picture 7.
| Control byte | Data byte | Control byte | Data byte | ||||||||||||||||||||||||||||||
| Start | RW | Register address (F4h) | Data register - address F4h | RW | Register address (F5h) | Data register - adress F5h | Stop | ||||||||||||||||||||||||||
| CSB=0 | 0 | 1 | 1 | 1 | 0 | 1 | 0 | 0 | bit7 | bit6 | bit5 | bit4 | bit3 | bit2 | bit1 | bit0 | 0 | 1 | 1 | 1 | 0 | 1 | 0 | 1 | bit7 | bit6 | bit5 | bit4 | bit3 | bit2 | bit1 | bit0 | CSB=1 |
Picture 7: SPI multiple byte write (not auto-incremented)
6.3.2 SPI read
Reading is done by lowering CSB and first sending one control byte. The control bytes consist of the SPI register address (= full register address without bit 7) and the read command (bit $7 = \mathsf { R W } = { \mathsf { \Omega } } ^ { \ast } 1 ^ { \mathfrak { s } } )$ . After writing the control byte, data is sent out of the SDO pin (SDI in 3-wire mode); the register address is automatically incremented. The SPI read protocol is depicted in Picture 8.
| Control byte | Data byte | Data byte | ||||||||||||||||||||||
| Start | RW | Register address (F6h) | Data register - address F6h | Data register - address F7h | Stop | |||||||||||||||||||
| CSB=0 | 1 | 1 | 1 | 1 | 0 | 1 | 1 | 0 | bit15 | bit14 | bit13 | bit12 | bit11 | bit10 | bit9 | bit8 | bit7 | bit6 | bit5 | bit4 | bit3 | bit2 | bit1 | bit0 |
Picture 8: SPI multiple byte read
6.4 Interface parameter specification
6.4.1 General interface parameters
Table 21: Interface parameters
| Parameter | Symbol | Condition | Min | Typ | Max | Unit |
| Input low level | $V_{il\_si}$ | $V_{DDIO}=1.2 V to 3.6 V$ | 20 | % $V_{DDIO}$ | ||
| Input high level | $V_{ih\_si}$ | $V_{DDIO}=1.2 V to 3.6 V$ | 80 | % $V_{DDIO}$ | ||
| Output low level $I^{2}C$ | $V_{ol\_SDI}$ | $V_{DDIO}=1.62 V, I_{ol}=3 mA$ | 20 | % $V_{DDIO}$ | ||
| Output low level $I^{2}C$ | $V_{ol\_SDI\_1.2}$ | $V_{DDIO}=1.20 V, I_{ol}=3 mA$ | 23 | % $V_{DDIO}$ | ||
| Output low level SPI | $V_{ol\_SDO}$ | $V_{DDIO}=1.62 V, I_{ol}=1 mA$ | 20 | % $V_{DDIO}$ | ||
| Output low level SPI | $V_{ol\_SDO\_1.2}$ | $V_{DDIO}=1.20 V, I_{ol}=1 mA$ | 23 | % $V_{DDIO}$ | ||
| Output high level | $V_{oh}$ | $V_{DDIO}=1.62 V, I_{oh}=1 mA (SDO, SDI)$ | 80 | % $V_{DDIO}$ | ||
| Output high level | $V_{oh\_1.2}$ | $V_{DDIO}=1.20 V, I_{oh}=1 mA (SDO, SDI)$ | 60 | % $V_{DDIO}$ | ||
| Pull-up resistor | $R_{pull}$ | Internal CSB pull-up resistor to $V_{DDIO}$ | 70 | 120 | 190 | kΩ |
| $I^{2}C bus load capacitor$ | $C_b$ | On SDI and SCK | 400 | pF |
6.4.2 I²C timings
For I²C timings, the following abbreviations are used:
• “S&F mode” = standard and fast mode
• “HS mode” = high speed mode
• Cb = bus capacitance on SDA line
All other naming refers to I²C specification 2.1 (January 2000).
The I²C timing diagram is in Picture 9. The corresponding values are given in Table 22
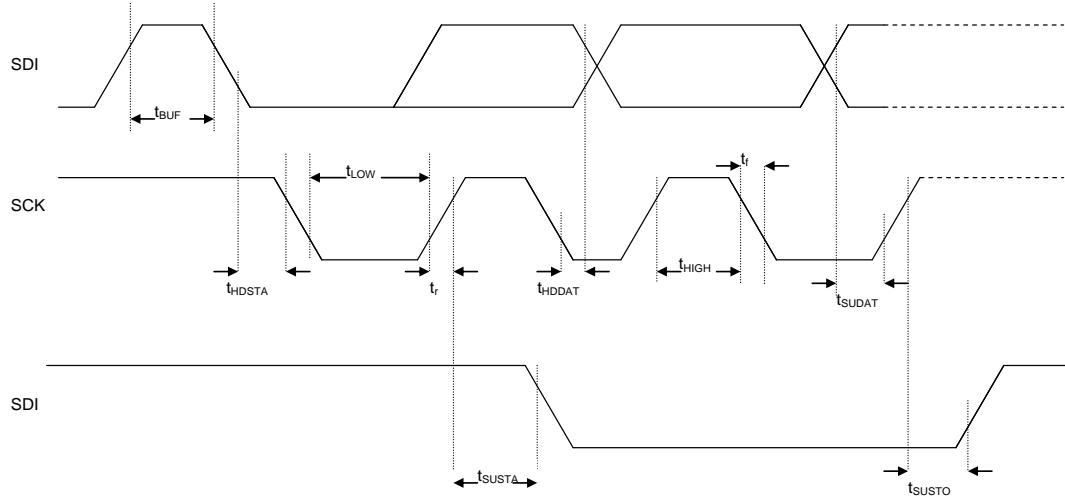
Picture 9: I2C timing diagram
Table 22: I2C timings
| Parameter | Symbol | Condition | Min | Typ | Max | Unit |
| SDI setup time | $t_{SU;DAT}$ | S&F ModeHS mode | 16030 | nsns | ||
| SDI hold time | $t_{HD;DAT}$ | S&F Mode, $C_b\leq 100$ pFS&F Mode, $C_b\leq 400$ pFHS mode, $C_b\leq 100$ pFHS mode, $C_b\leq 400$ pF | 80901824 | 115150 | nsnsns | |
| SCK low pulse | $t_{LOW}$ | HS mode, $C_b\leq 100$ pF $V_{DDIO}=1.62 V$ | 160 | ns | ||
| SCK low pulse | $t_{LOW}$ | HS mode, $C_b\leq 100$ pF $V_{DDIO}=1.2 V$ | 210 | ns |
The above-mentioned I2C specific timings correspond to the following internal added delays:
Input delay between SDI and SCK inputs: SDI is more delayed than SCK by typically 100 ns in Standard and Fast Modes and by typically 20 ns in High Speed Mode.
Output delay from SCK falling edge to SDI output propagation is typically 140 ns in Standard and Fast Modes and typically 70 ns in High Speed Mode.
6.4.3 SPI timings
The SPI timing diagram is in Picture 10, while the corresponding values are given in Table 23. All timings apply both to 4- and 3-wire SPI.
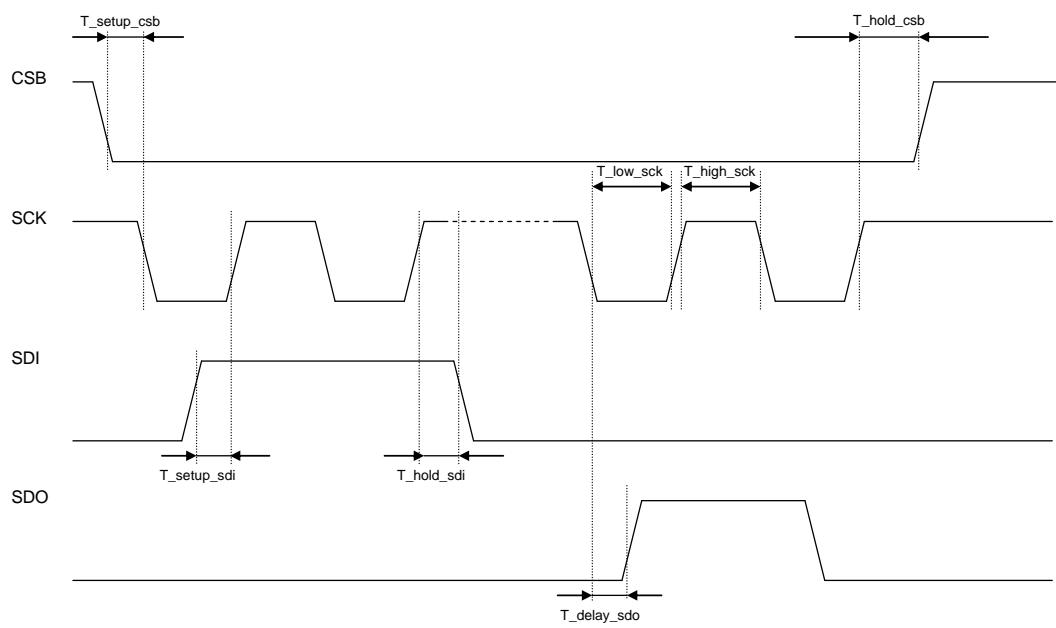
Picture 10: SPI timing diagram
Table 23: SPI timings
| Parameter | Symbol | Condition | Min | Typ | Max | Unit |
| SPI clock i/p frequency | F_spi | 0 | 10 | MHz | ||
| SCK low pulse | T_low_sck | 20 | ns | |||
| SCK high pulse | T_high_sck | 20 | ns | |||
| SDI setup time | T_setup_sdi | 20 | ns | |||
| SDI hold time | T_hold_sdi | 20 | ns | |||
| SDO output delay | T_delay_sdo | 25 pF load, $V_{DDIO}=1.6$ V min | 30 | ns | ||
| SDO output delay | T_delay_sdo | 25 pF load, $V_{DDIO}=1.2$ V min | 40 | ns | ||
| CSB setup time | T_setup_csb | 20 | ns | |||
| CSB hold time | T_hold_csb | 20 | ns | |||
| SPI clock input frequency | F_spi | 0 | 10 | MHz |
7. Pin-out and connection diagram
7.1 Pin-out
The pin numbering of BME680 is performed in the untypical clockwise direction when seen in top view and counter-clockwise when seen in bottom view. Picture 11 and Table 24 give a detailed description and illustration of the input/output pins.
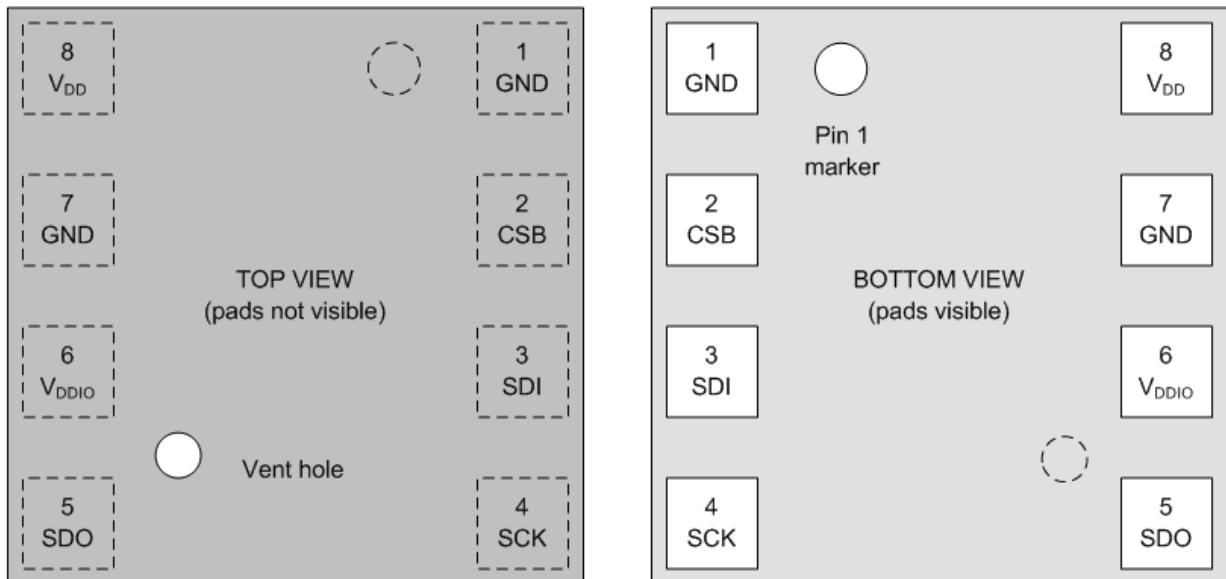
Picture 11: Top (left) and bottom (right) views of the chip with input/output pins
Table 24: Pin description
| Pin | Name | I/O type | Description | Connection | ||
| SPI 4W | SPI 3W | $I^2C$ | ||||
| 1 | GND | Supply | Ground | GND | ||
| 2 | CSB | In | Chip select | CSB | CSB | $V_{DDIO}$ |
| 3 | SDI | In/Out | Serial data input | SDI | SDI/SDO | SDA |
| 4 | SCK | In | Serial clock input | SCK | SCK | SCL |
| 5 | SDO | In/Out | Serial data output | SDO | DNC | GND for default address |
| 6 | $V_{DDIO}$ | Supply | Digital / Interface supply | $V_{DDIO}$ | ||
| 7 | GND | Supply | Ground | GND | ||
| 8 | $V_{DD}$ | Supply | Analog supply | $V_{DD}$ | ||
7.2 Connection diagrams
For the I2C connection, it is recommended to use 100 nF for ${ \mathsf { C } } 1$ and $\mathsf { C } _ { 2 } .$ Moreover, the value for the pull-up resistors $\mathsf { R } _ { 1 }$ and ${ \sf R } _ { 2 }$ should be based on the interface timing and the bus load; a normal value is 4.7 kΩ. Finally, a direct connection between CSB and $V _ { \mathsf { D D } } | \mathsf { O }$ is required. Similarly for the 4- and 3-wire SPI connections, it is suggested to use 100 nF for $\mathsf { C } _ { 1 }$ and $\mathsf { C } _ { 2 } .$
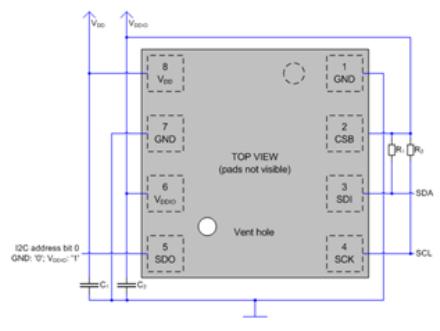
(a)
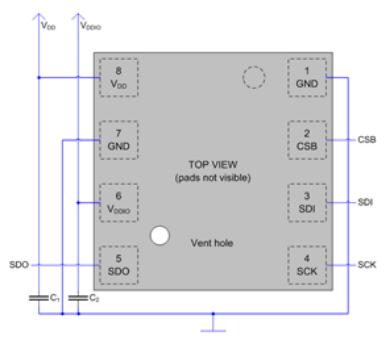
(b)
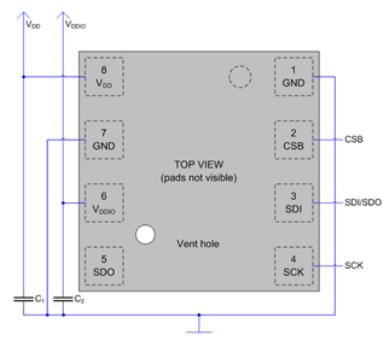
(c)
Picture 12: Connection diagrams for (a) ${ \mathsf { I } } ^ { 2 } { \mathsf { C } } ,$ (b) 4-wire SPI, and (c) 3-wire SPI
7.3 Package dimensions
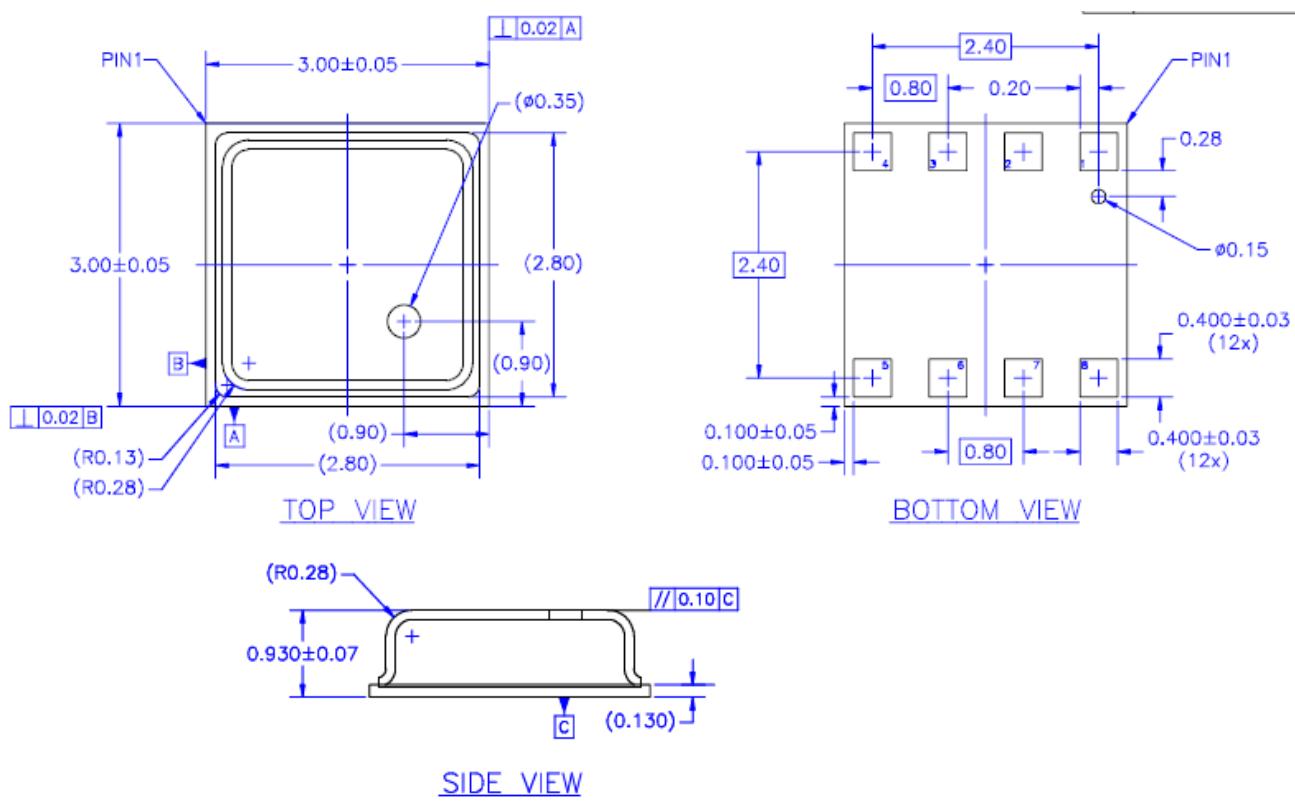
2. REFERENCE SPECIFICATIONS: A. AWW SPEC #001-0531-2234: PACKING OPERATION PROCEDURE. B. AWW SPEC #001-0519-2062: MARKING.
- ALL DIMENSIONS AND TOLERANCES CONFORM TO ANSI Y14.5M-1994.
NOTES: UNLESS OTHERWISE SPECIFIED
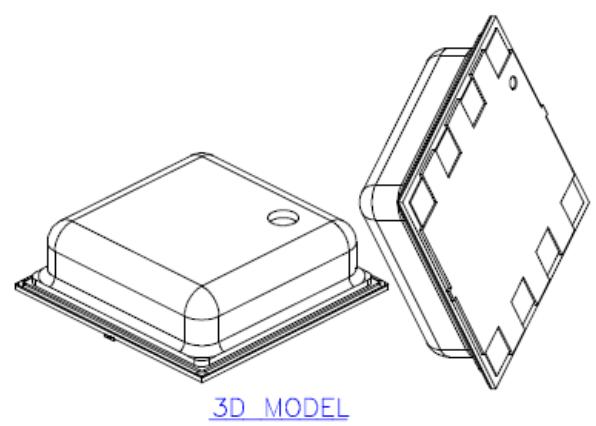
Picture 13: Package dimensions for top, bottom and side view
7.4 Landing pattern recommendation
For the design of the landing pattern, the dimensions shown in Picture 14: Recommended landing pattern (top view; dimensions are in millimeters) are recommended. It is important to note that areas marked in red are exposed PCB meta pads.
• In case of a solder mask defined (SMD) PCB process, the land dimensions should be defined by solder mask openings. The underlying metal pads are larger than these openings.
In case of a non-solder mask defined (NSMD) PCB process, the land dimensions should be defined in the meta layer. The mask openings are larger than these metal pads.
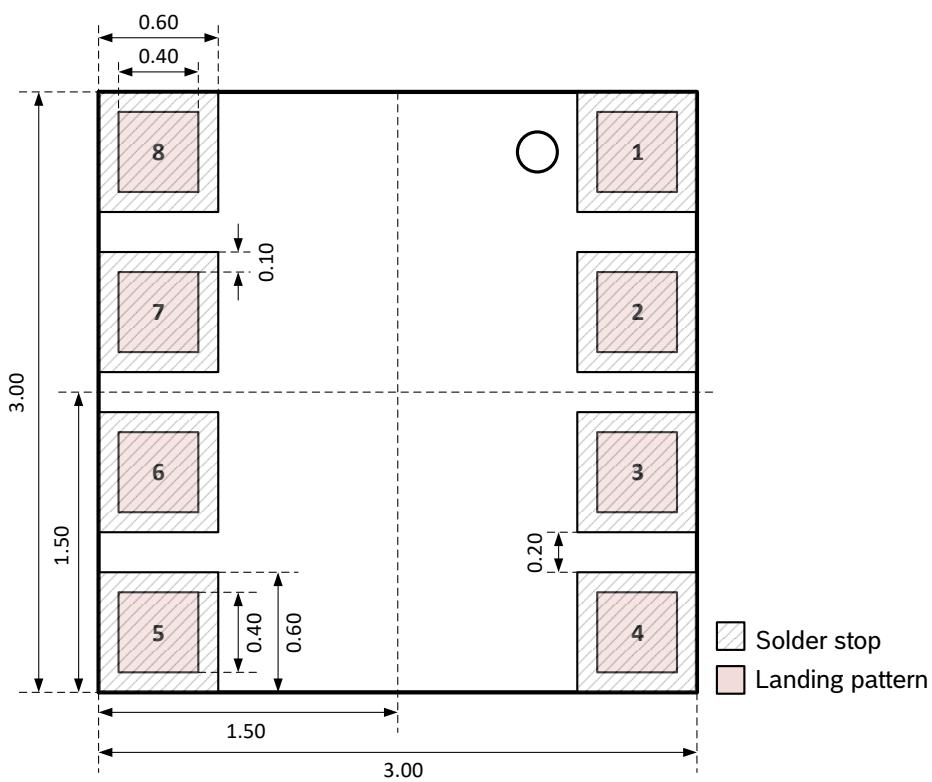
Picture 14: Recommended landing pattern (top view; dimensions are in millimeters)
7.5 Marking
7.5.1 Mass production devices
Table 25: Marking of mass production parts
| Marking | Symbol | Description |
| Vent_hole<img src="./images/01ee748aaa54f0136770ea63da521cd587d7c9a541e055e57e13a81ad311c4af.jpg"/> | CCC | Lot counter: 3 alphanumeric digits, variable to generate mass production trace-code |
| T | Product number: 1 alphanumeric digit, fixed to identify product type, T = “S” or “E”: “S” is associated with the BME680 part number 0 273 141 229, “E” is associated with the BME680 part number 0 273 141 312. | |
| L | Sub-contractor ID: 1 alphanumeric digit, variable to identify sub-contractor (L = “P”) |
7.5.2 Engineering samples
Table 26: Marking of engineering samples
| Marking | Symbol | Description | |
| Vent_hole | <img src="./images/98265f9c8ddb0de56653d65ef3791fd7a8828804419b98aa9ede1490ea52eb6f.jpg"/>←Pin 1 marker | XX | Sample ID: 2 alphanumeric digits, variable to generate trace-code |
| N | Eng. Sample ID: 1 alphanumeric digit, fixed to identify engineering sample, N = “*” or “e” or “E” | ||
| CC | Counter ID: 2 alphanumeric digits, variable to generate trace-code | ||
7.6 Soldering guidelines and reconditioning recommendations
The moisture sensitivity level of the BME680 sensors corresponds to JEDEC Level 1, see also:
• IPC/JEDEC J-STD-020C “Joint Industry Standard: Moisture/Reflow Sensitivity Classification for non-hermetic Solid State Surface Mount Devices”
IPC/JEDEC J-STD-033A “Joint Industry Standard: Handling, Packing, Shipping and Use of Moisture/Reflow Sensitive Surface Mount Devices”
The sensor fulfils the lead-free soldering requirements of the above-mentioned IPC/JEDEC standard, i.e. reflow soldering with a peak temperature up to $2 6 0 ^ { \circ } \mathsf { C }$ . The minimum height of the solder after reflow shall be at least 50 µm. This is required for good mechanical decoupling between the sensor device and the printed circuit board (PCB).
| Profile Feature | Pb-Free Assembly | |
| Average Ramp-Up Rate (Tsmax to Tp) | 3°C/second max. | |
| Preheat- Temperature Min (Tsmin)- Temperature Max (Tsmax)- Time (tsmin to tsmax) | 150 °C200 °C60-180 seconds | |
| Time maintained above:- Temperature (TL)- Time (tL) | 217 °C60-150 seconds | |
| Peak/Classification Temperature (Tp) | 260 °C | |
| Time within 5 °C of actual Peak Temperature (tp) | 20-40 seconds | |
| Ramp-Down Rate | 6 °C/second max. | |
| Time 25 °C to Peak Temperature | 8 minutes max. |
Note 1: All temperatures refer to topside of the package, measured on the package body surface

Picture 15: Soldering profile
7.7 Mounting and assembly recommendations
This HSMI-document provides all the necessary instructions to handle, solder and mount the environmental sensor BME680. Following the reported guidelines is very important to prevent the damage of the sensor and the resultant loss of warranty.
7.8 Environmental safety
7.8.1 RoHS
The BME680 sensor meets the requirements of the EC restriction of hazardous substances (RoHS) directive, see also:
Directive 2011/65/EU and its amendments, including the amendment 2015/863/EU on the restriction of the use of certain hazardous substances in electrical and electronic equipment.
7.8.2 Halogen content
The BME680 is halogen-free. For more details on the analysis results please contact your Bosch Sensortec representative.
7.8.3 Internal package structure
Within the scope of Bosch Sensortec’s ambition to improve its products and secure the mass product supply, Bosch Sensortec qualifies additional sources (e.g. 2nd source) for the packaging and processing of the BME680.
While Bosch Sensortec took care that all of the technical packages parameters are described above are 100% identical for all sources, there can be differences in the chemical content and the internal structural between the different package sources.
However, as secured by the extensive product qualification process of Bosch Sensortec, this has no impact to the usage or to the quality of the BME680 product.
8. Legal disclaimer
8.1 Engineering samples
Engineering Samples are marked with an asterisk (*), (E) or (e). Samples may vary from the valid technica specifications of the product series contained in this data sheet. They are therefore not intended or fit for resale to third parties or for use in end products. Their sole purpose is internal client testing. The testing of an engineering sample may in no way replace the testing of a product series. Bosch Sensortec assumes no liability for the use of engineering samples. The Purchaser shall indemnify Bosch Sensortec from all claims arising from the use of engineering samples.
8.2 Product use
Bosch Sensortec products are developed for the consumer goods industry. They may only be used within the parameters of this product data sheet. They are not fit for use in life-sustaining or safety-critical systems. Safety critical systems are those for which a malfunction is expected to lead to bodily harm, death or severe property damage. In addition, they shall not be used directly or indirectly for military purposes (including but not limited to nuclear, chemical or biological proliferation of weapons or development of missile technology), nuclear power, deep sea or space applications (including but not limited to satellite technology).
Bosch Sensortec products are released on the basis of the legal and normative requirements relevant to the Bosch Sensortec product for use in the following geographical target market: BE, BG, DK, DE, EE, FI, FR, GR, IE, IT, HR, LV, LT, LU, MT, NL, AT, PL, PT, RO, SE, SK, SI, ES, CZ, HU, CY, US, CN, JP, KR, TW. If you need further information or have further requirements, please contact your local sales contact.
The resale and/or use of Bosch Sensortec products are at the purchaser’s own risk and his own responsibility. The examination of fitness for the intended use is the sole responsibility of the purchaser.
The purchaser shall indemnify Bosch Sensortec from all third party claims arising from any product use not covered by the parameters of this product data sheet or not approved by Bosch Sensortec and reimburse Bosch Sensortec for all costs in connection with such claims.
The purchaser accepts the responsibility to monitor the market for the purchased products, particularly with regard to product safety, and to inform Bosch Sensortec without delay of all safety-critical incidents
8.3 Application examples and hints
With respect to any examples or hints given herein, any typical values stated herein and/or any information regarding the application of the device, Bosch Sensortec hereby disclaims any and all warranties and liabilities of any kind, including without limitation warranties of non-infringement of intellectual property rights or copyrights of any third party. The information given in this document shall in no event be regarded as a guarantee of conditions or characteristics. They are provided for illustrative purposes only and no evaluation regarding infringement of intellectual property rights or copyrights or regarding functionality, performance or error has been made.
9. Document history and modifications
| Rev. | Chapter | Description of modifications | Date |
| 1.0 | Initial release | July 2017 | |
| 1.1 | 5.2 | Fixed typo | April 2019 |
| 7.5.1 | Added new technical reference code | ||
| 1.2 | Added Hyperlinks to Table of contents | May 2019 | |
| 1.2 | Table 4 updated | ||
| 3.3 | Added code examples & Tables 11-16 | ||
| 4.1 | Added q-ULP to Table 17 | ||
| Added new BSEC outputs to Table 18 | |||
| Removed Ambient temperature, Ambient relative humidity | |||
| 5.3.1.4 | Changed ranges of memory pages | ||
| 5.2 | Changed status register from 01h to 00h | ||
| 8. | New disclaimer | ||
| 1.3 | 1.4 | Removed link to T and H compensation formula | July 2019 |
| 1.4 | 3.3 | Updated pressure & humidity formula | June 2020 |
| 1.5 | 3.4.1, 4.1 | Improved wording | November 2020 |
| 8.2 | Disclaimer update | ||
| 1.6 | 3.3.3 | Table 13 corrected | January 2021 |
| 7.4 | Wording corrected | ||
| 1.7 | 7.8.1 | updated | December 2021 |
| 1.8 | 1.2 | Typical IAQ range updated according to BSEC 1.4.9.2 software improvements | August 2022 |
| 1.9 | 2 | Removed condensation parameter from table 9 | February 2024 |
Bosch Sensortec GmbH Gerhard-Kindler-Straße 9 72770 Reutlingen / Germany
Figures and diagrams from the PDF
Preview the extracted datasheet assets and open any image in a separate tab for closer inspection.


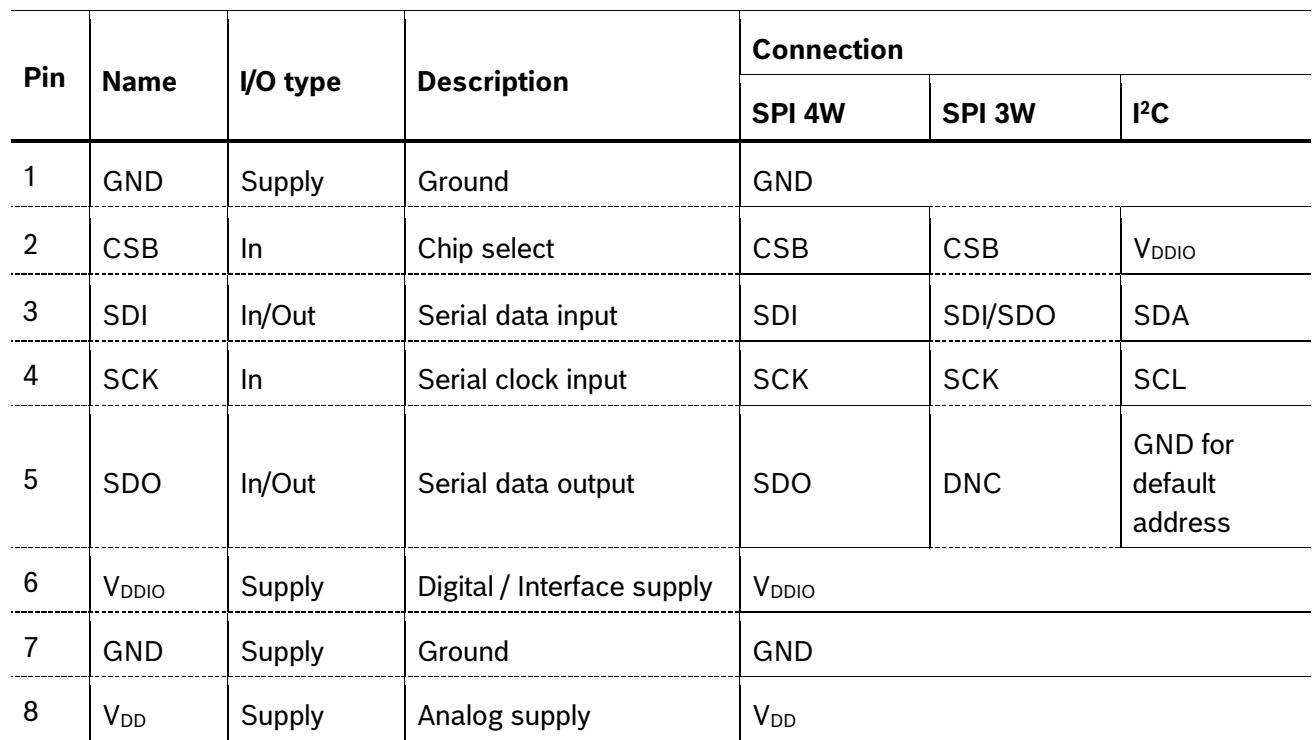
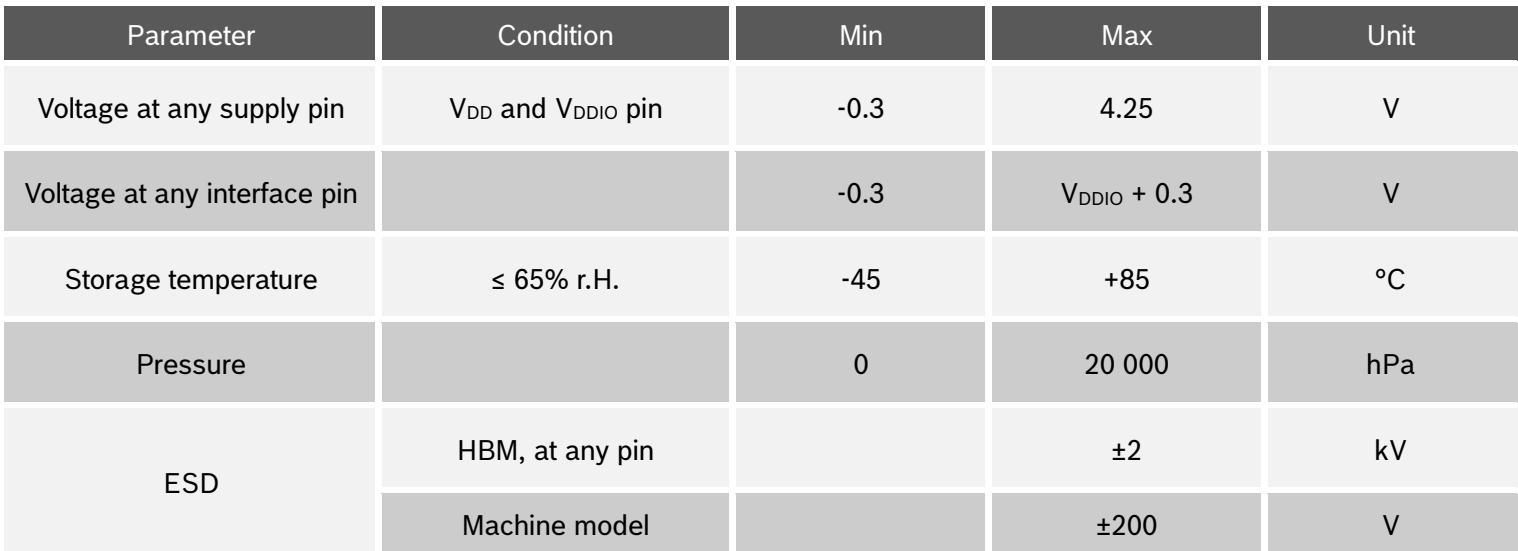
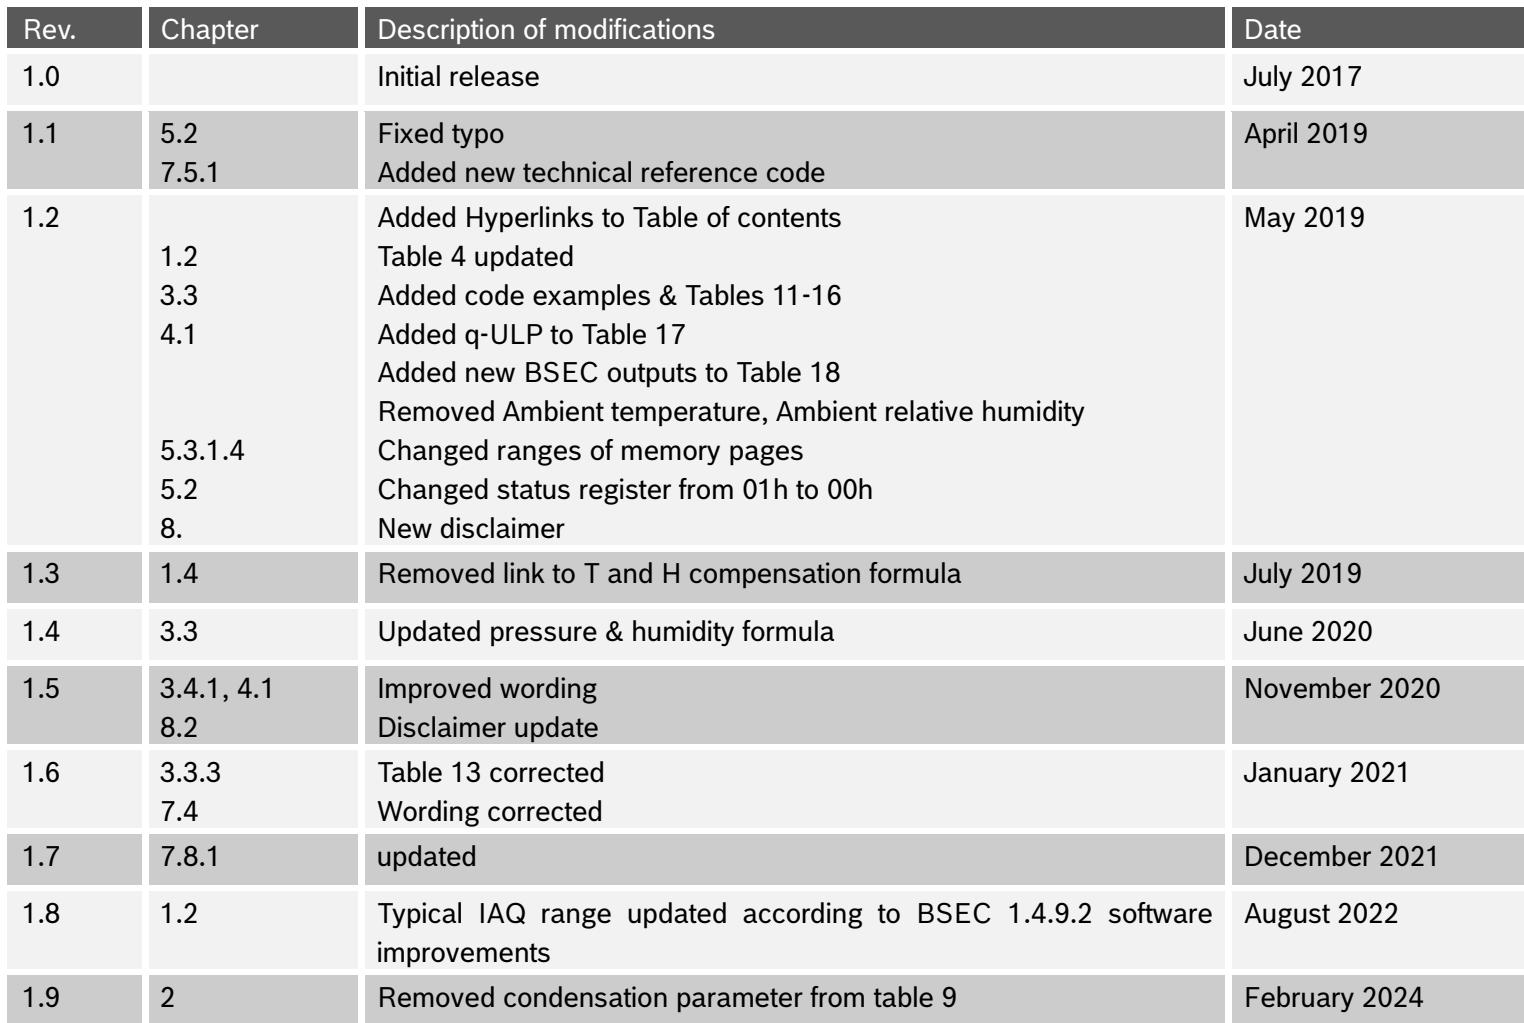
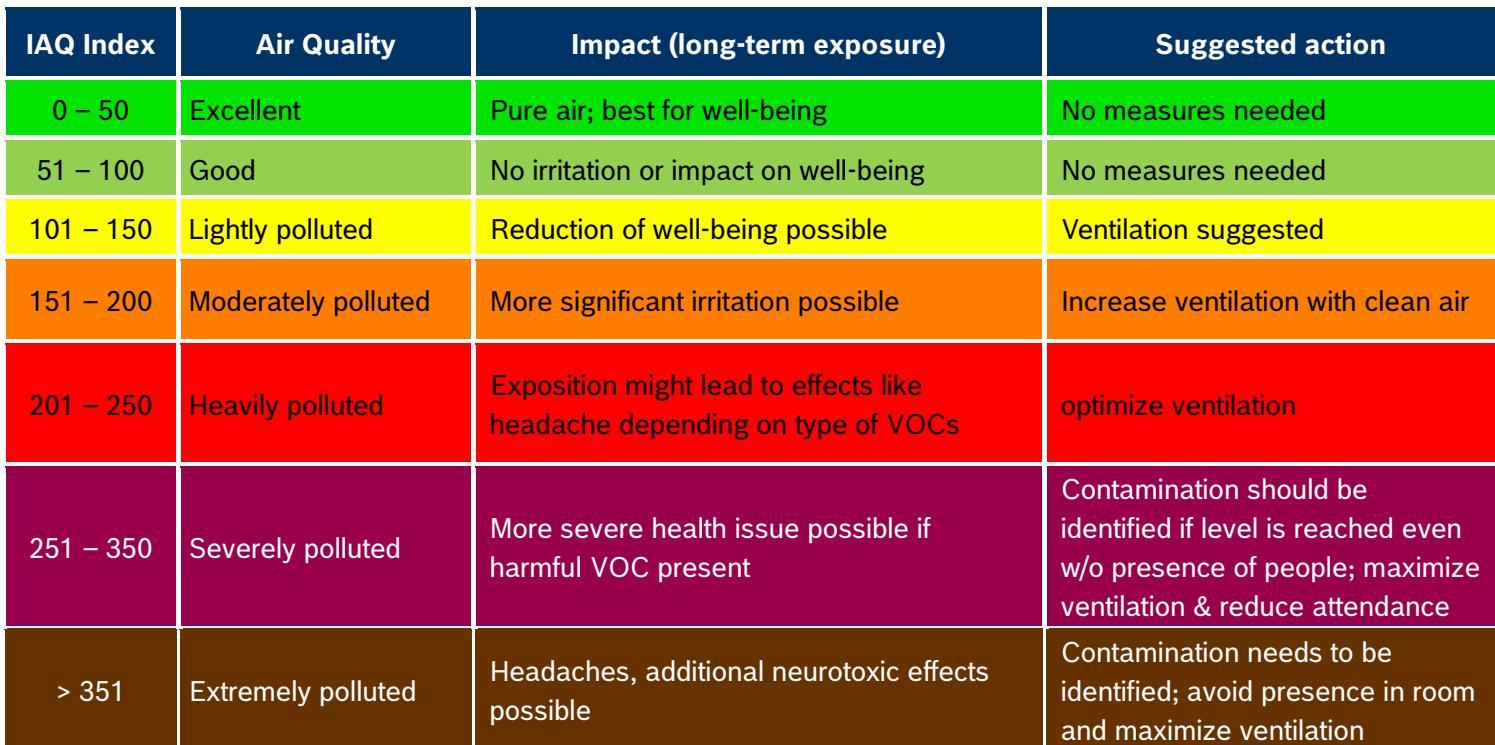
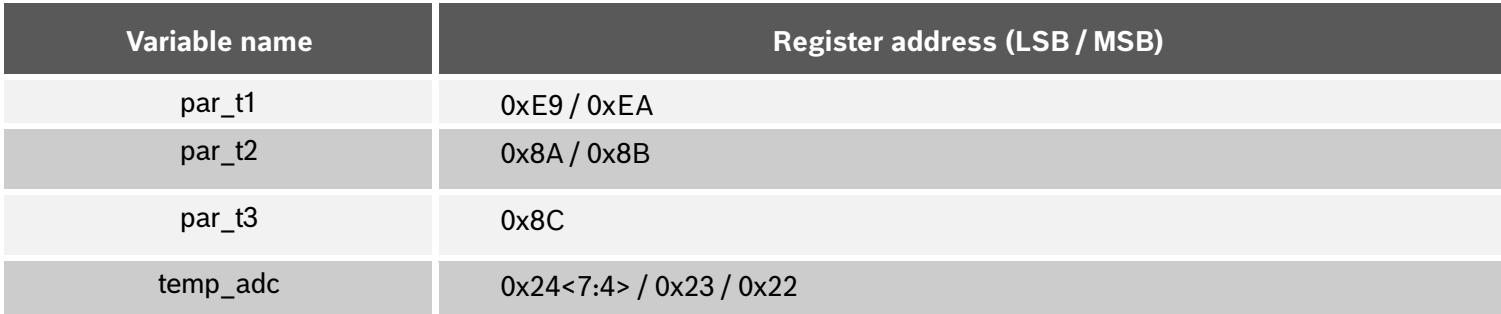
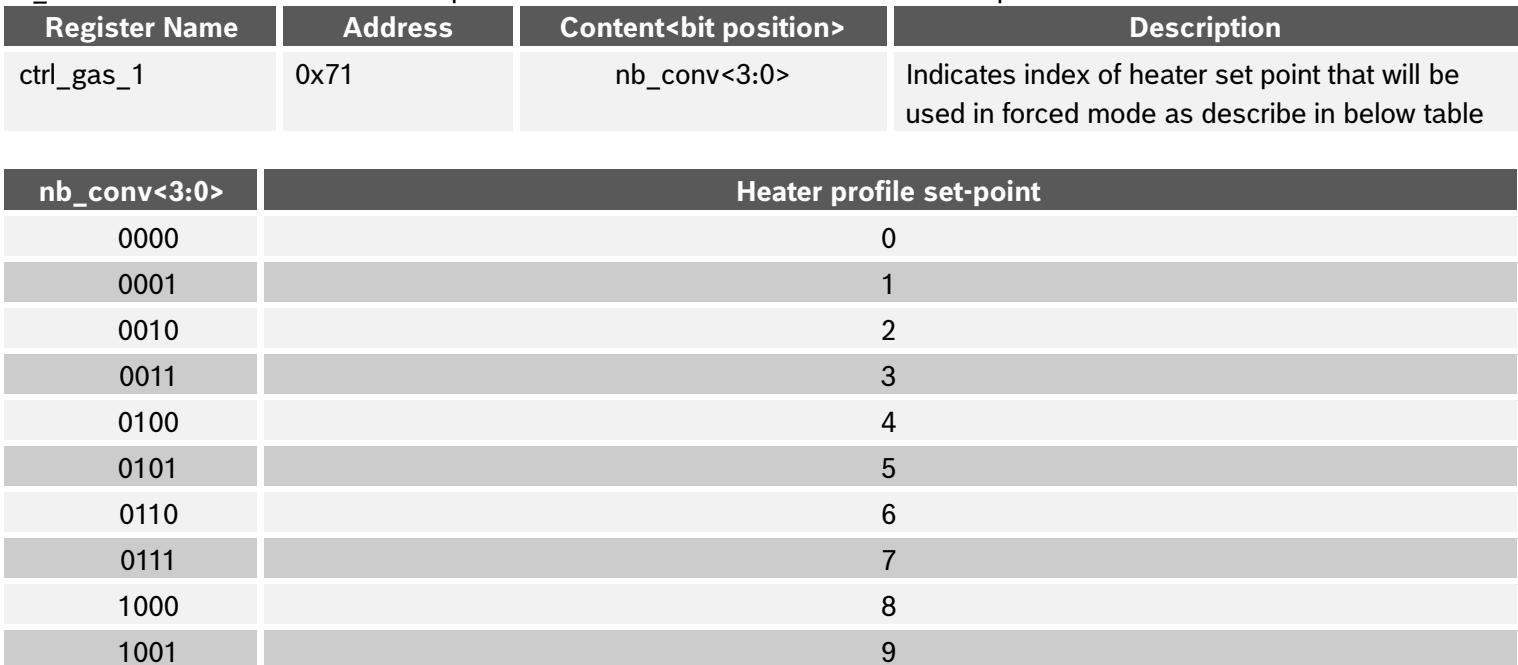
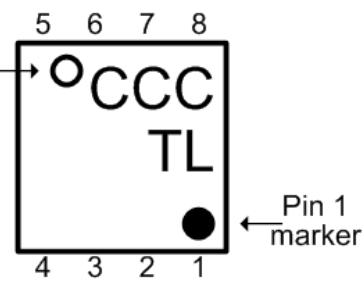
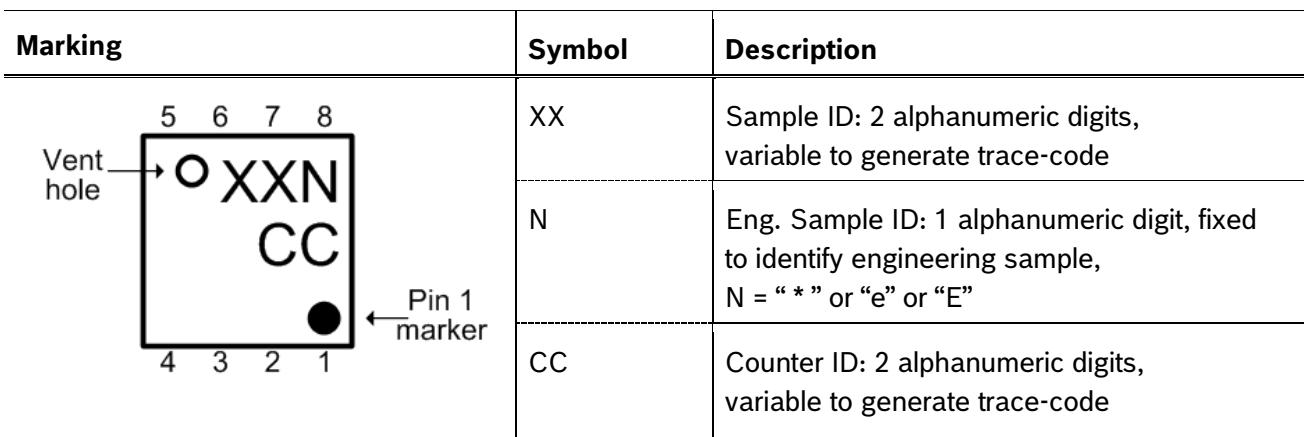
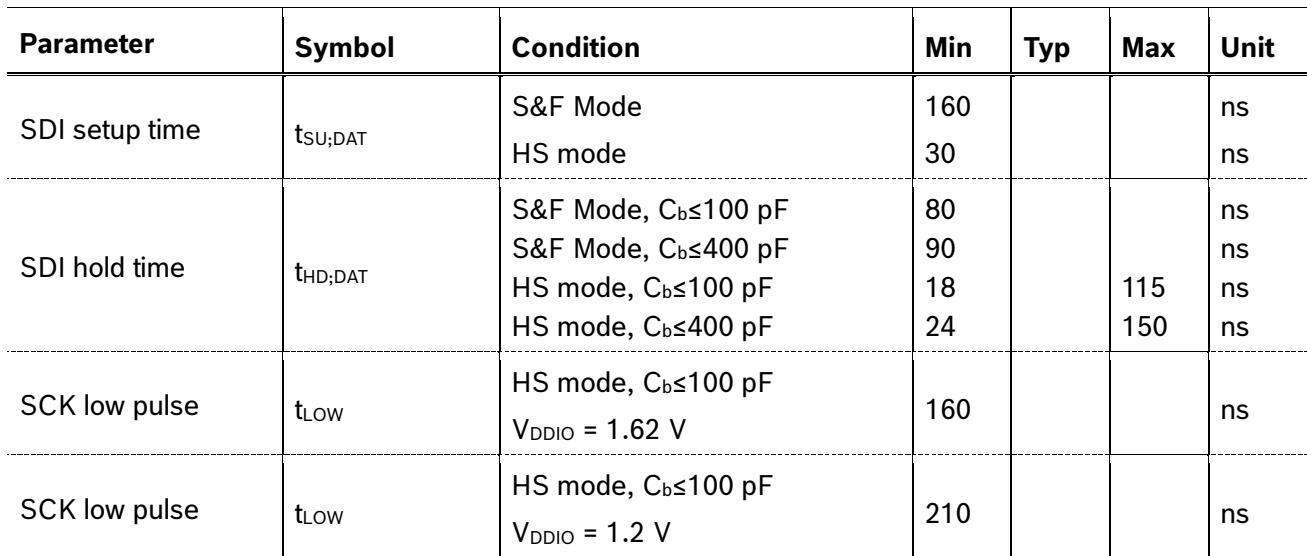

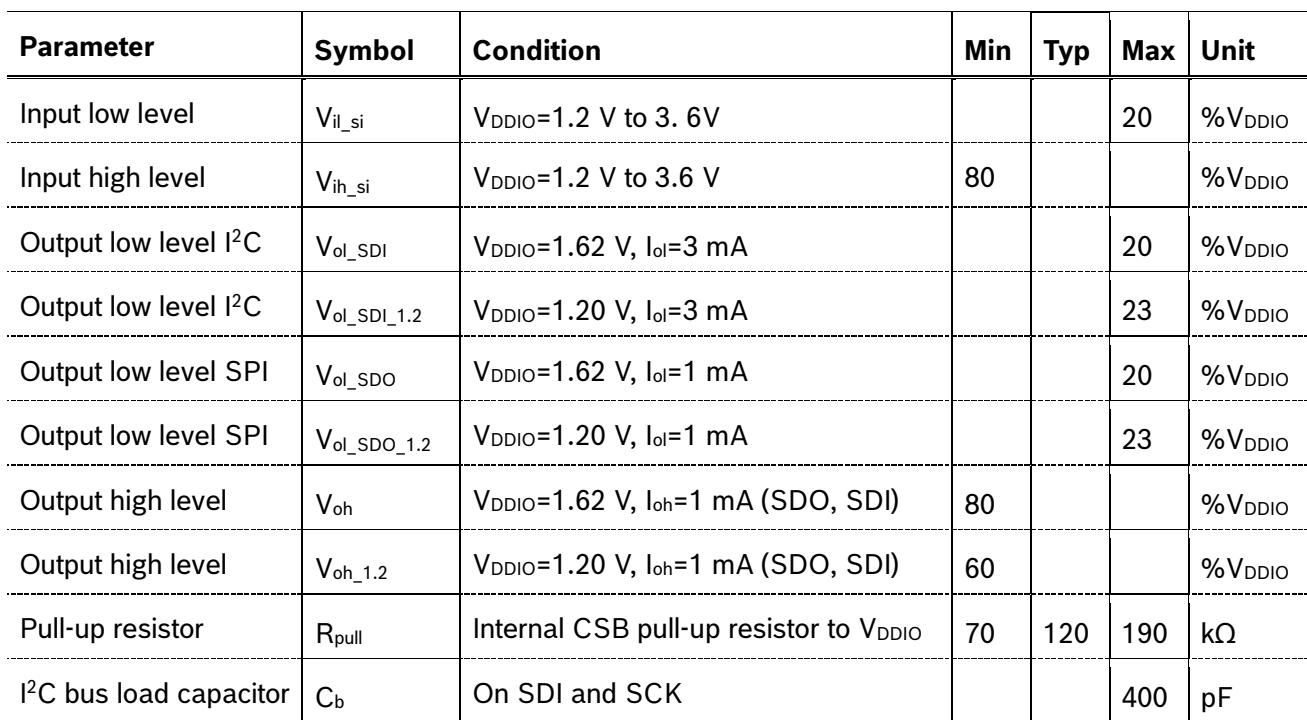
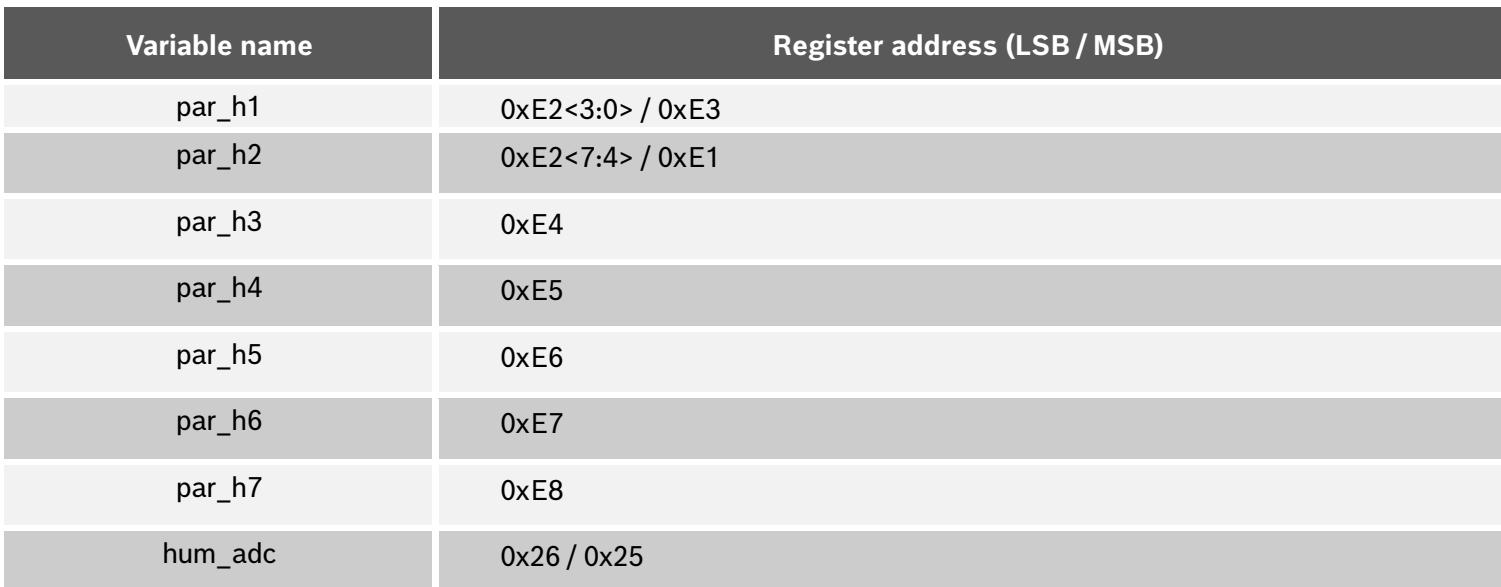
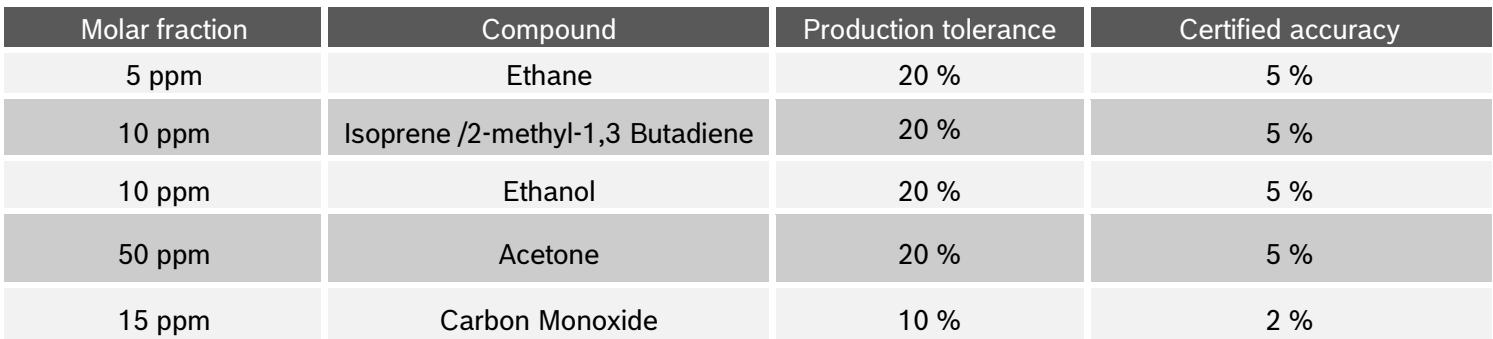
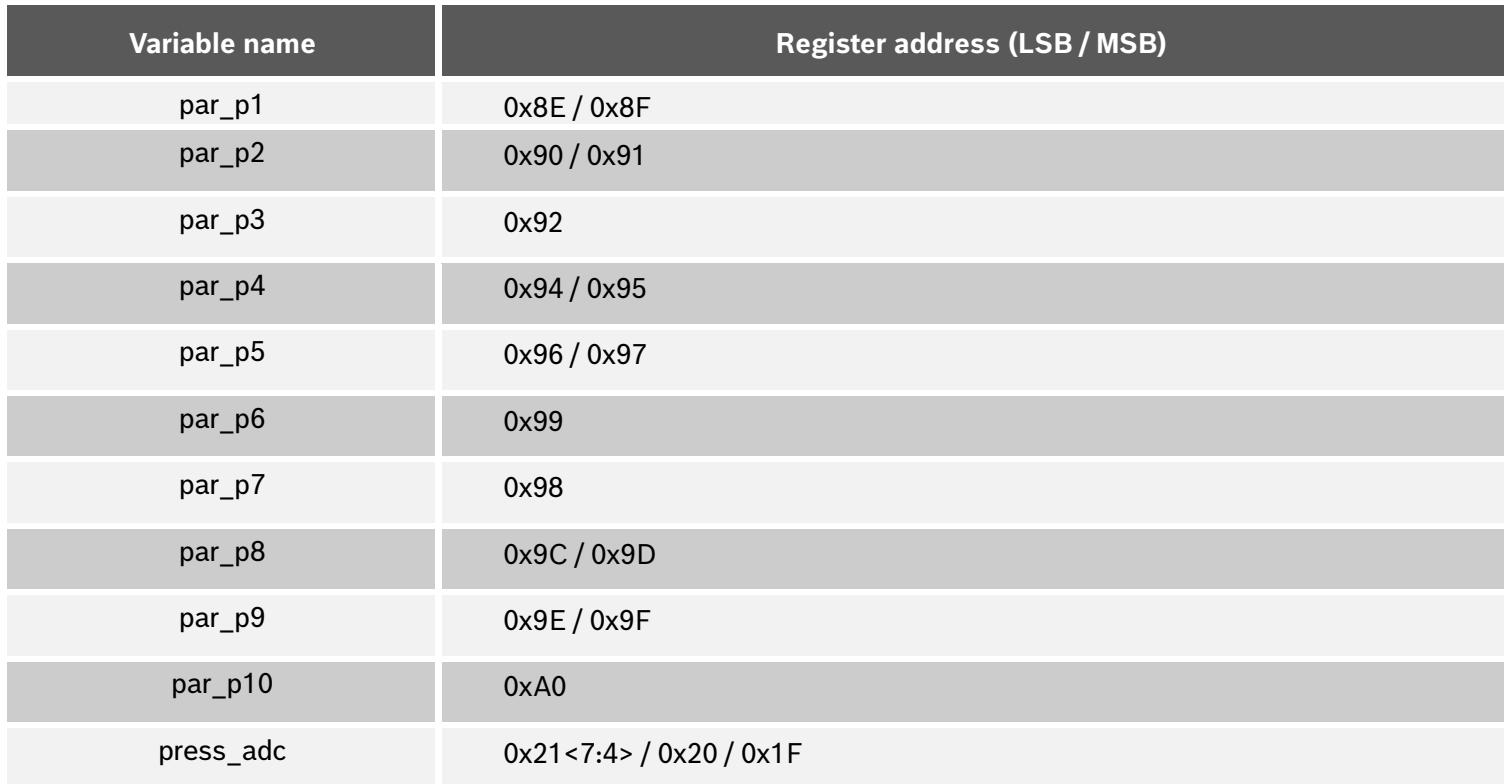

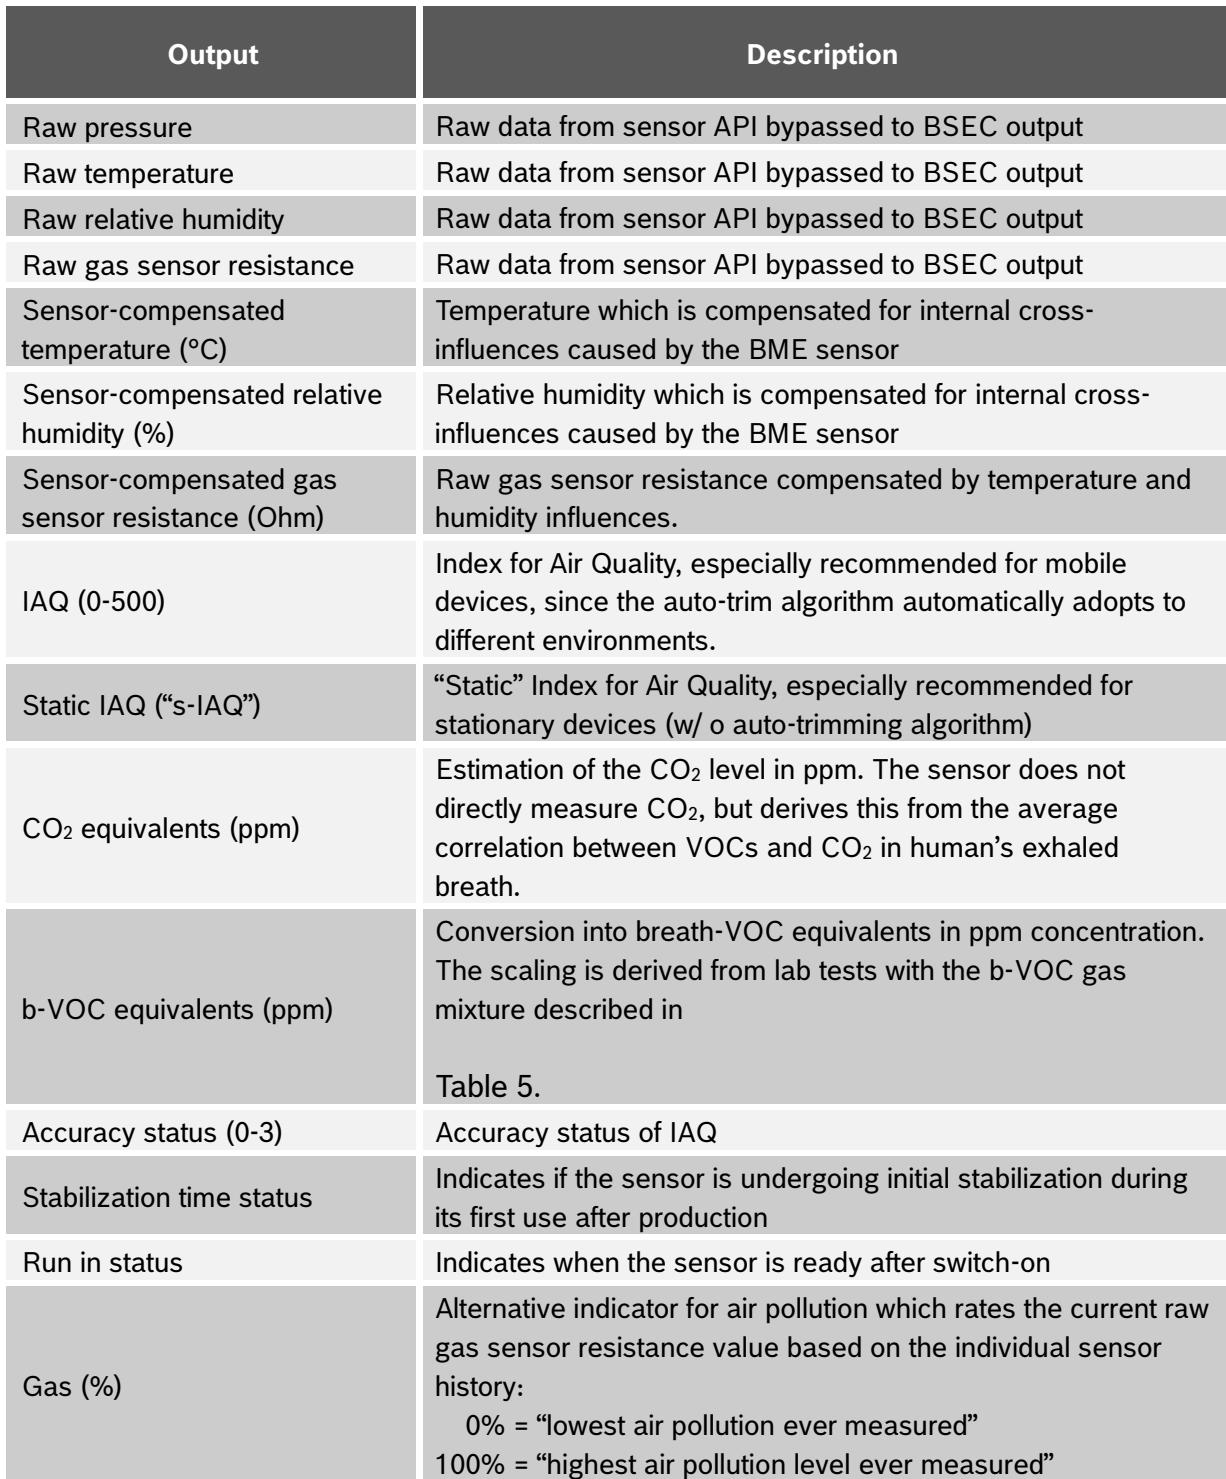
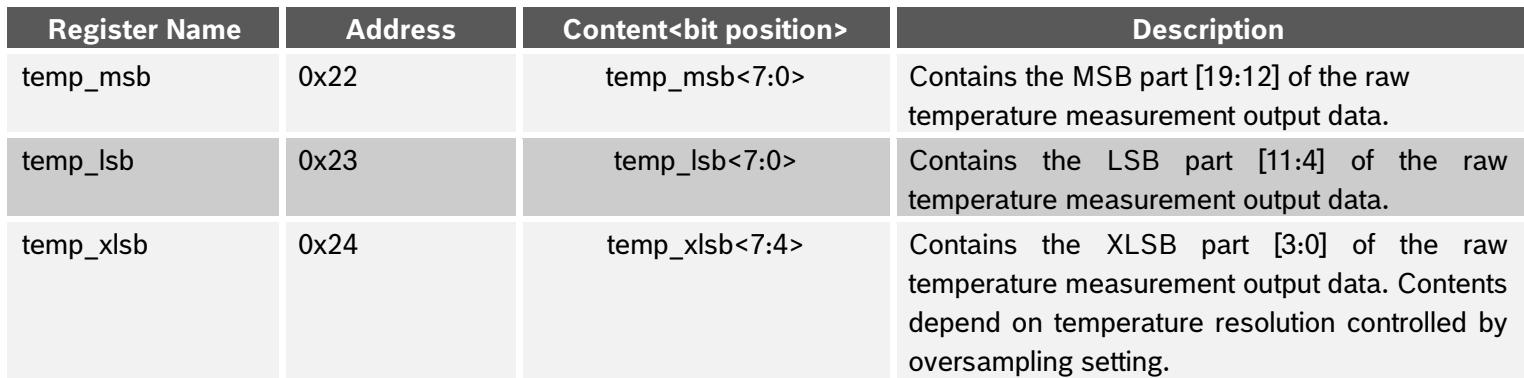

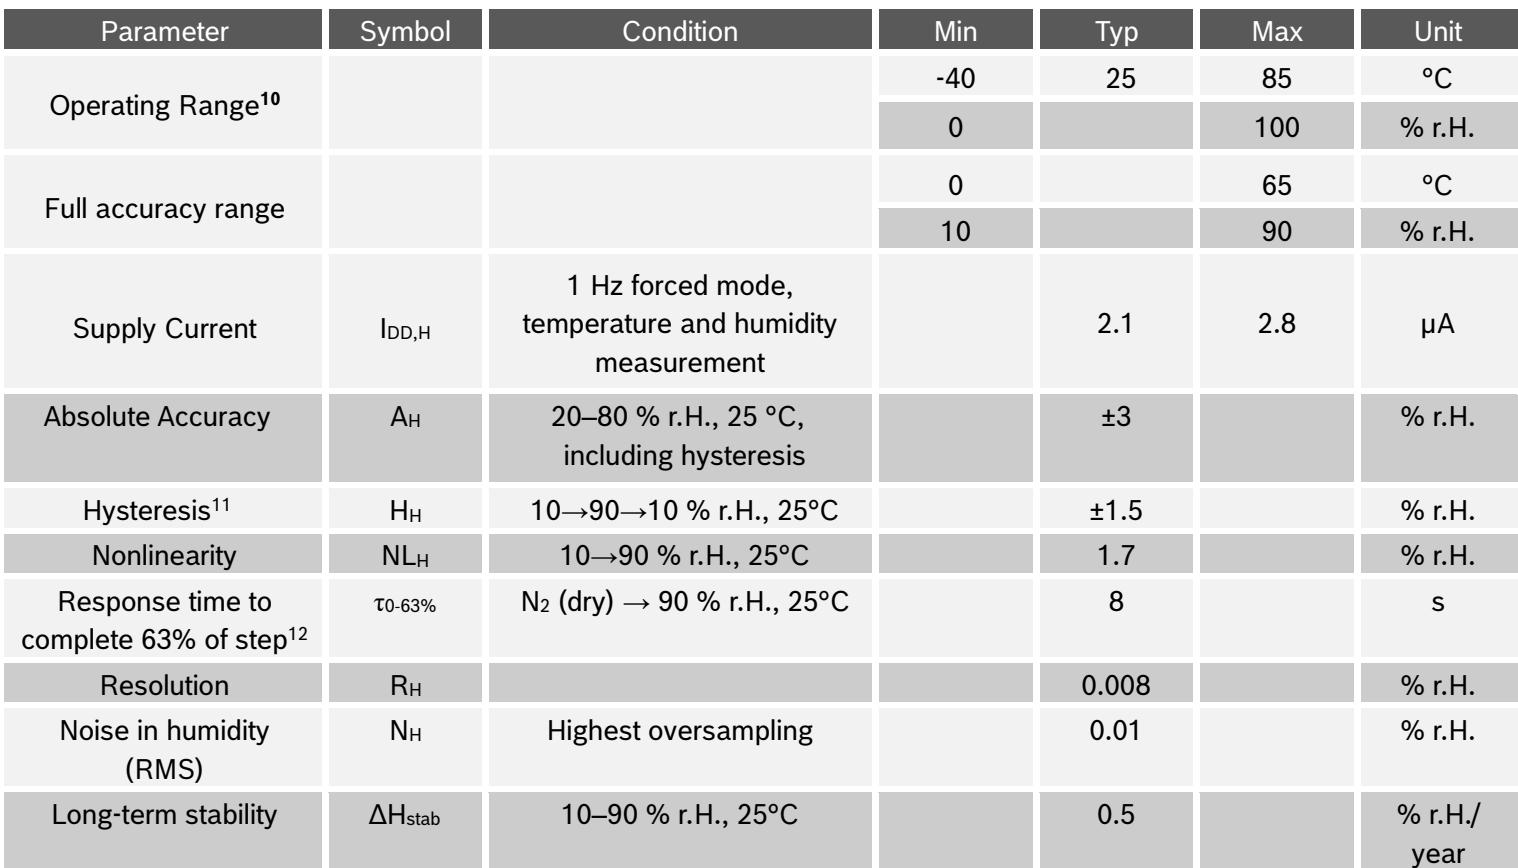


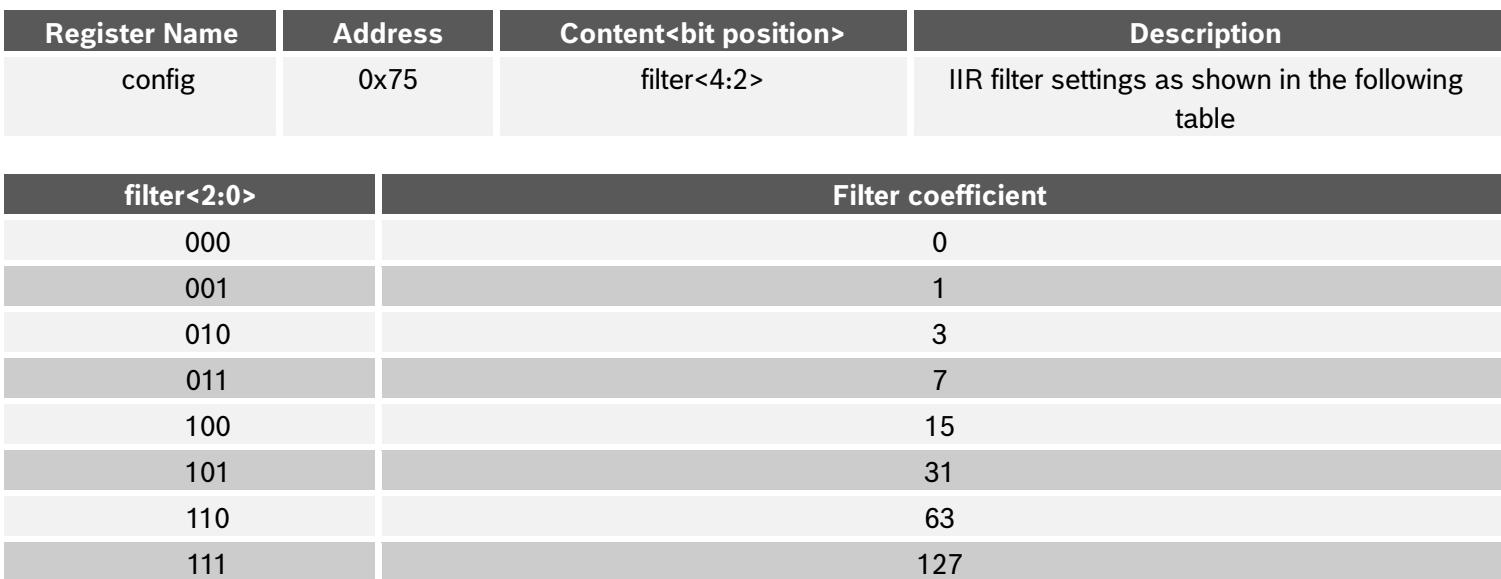




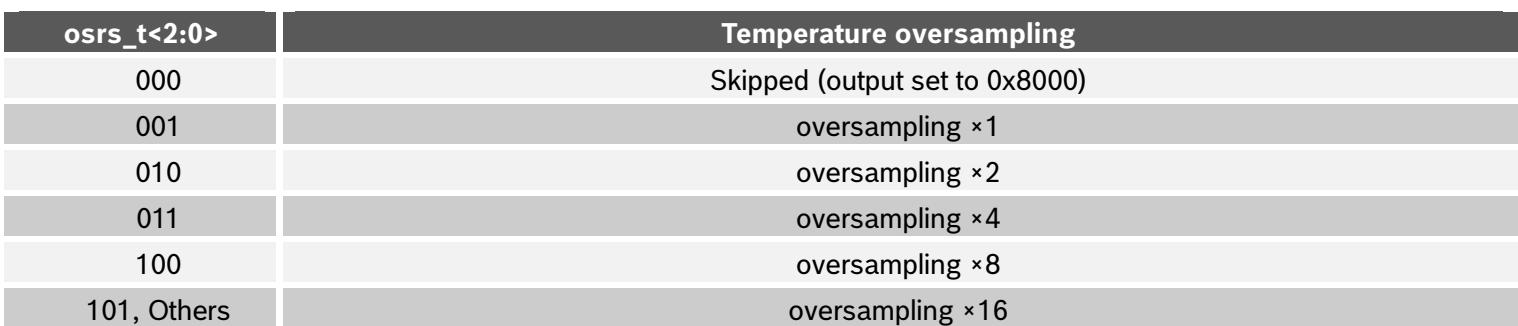
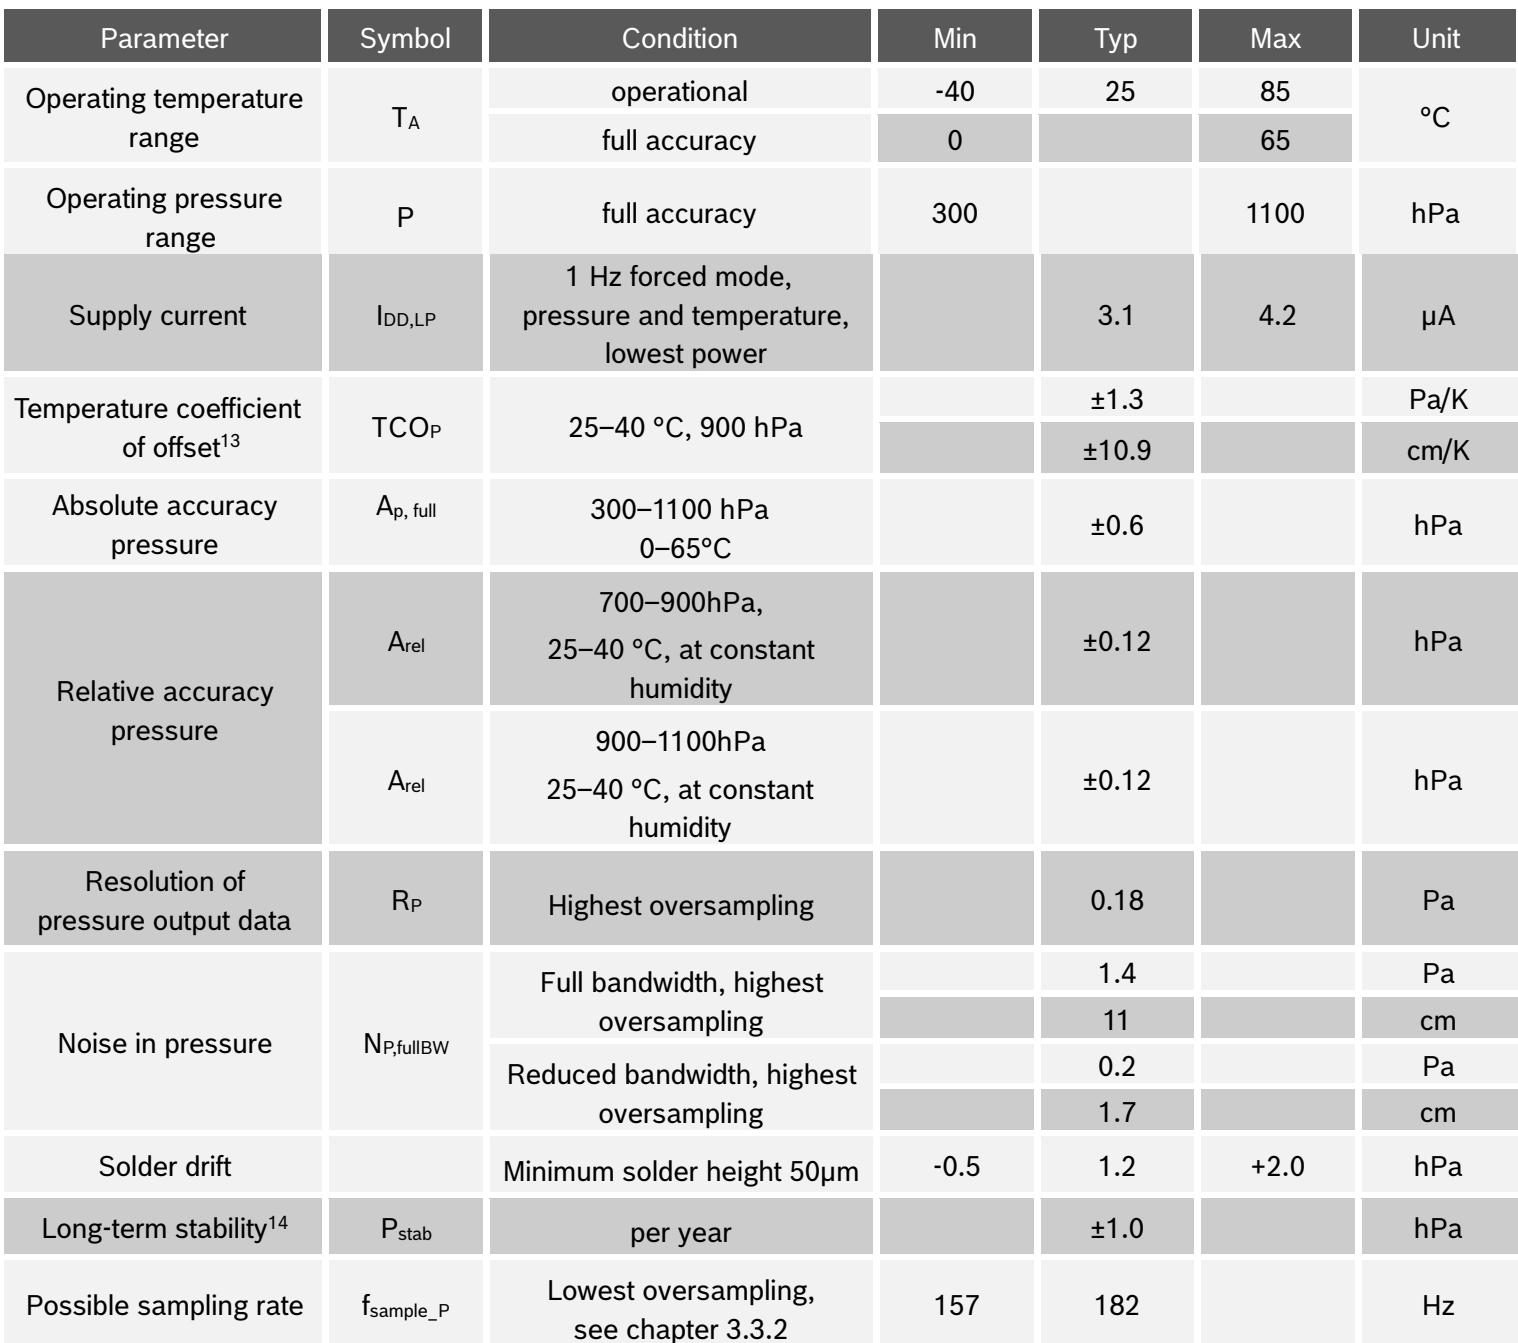
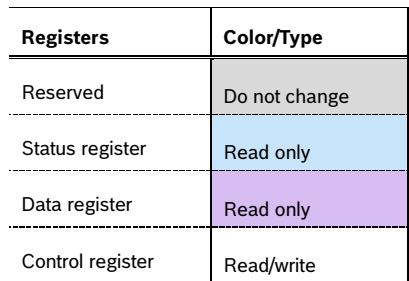
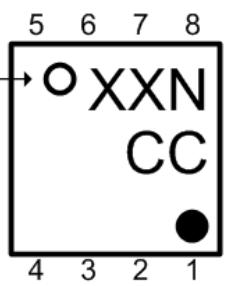
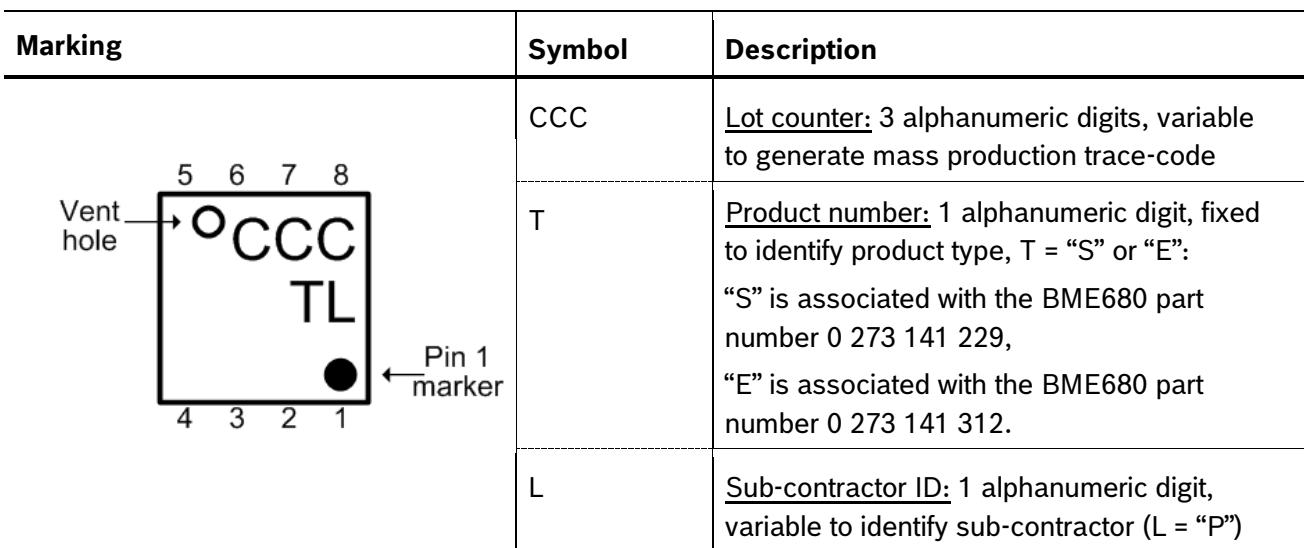





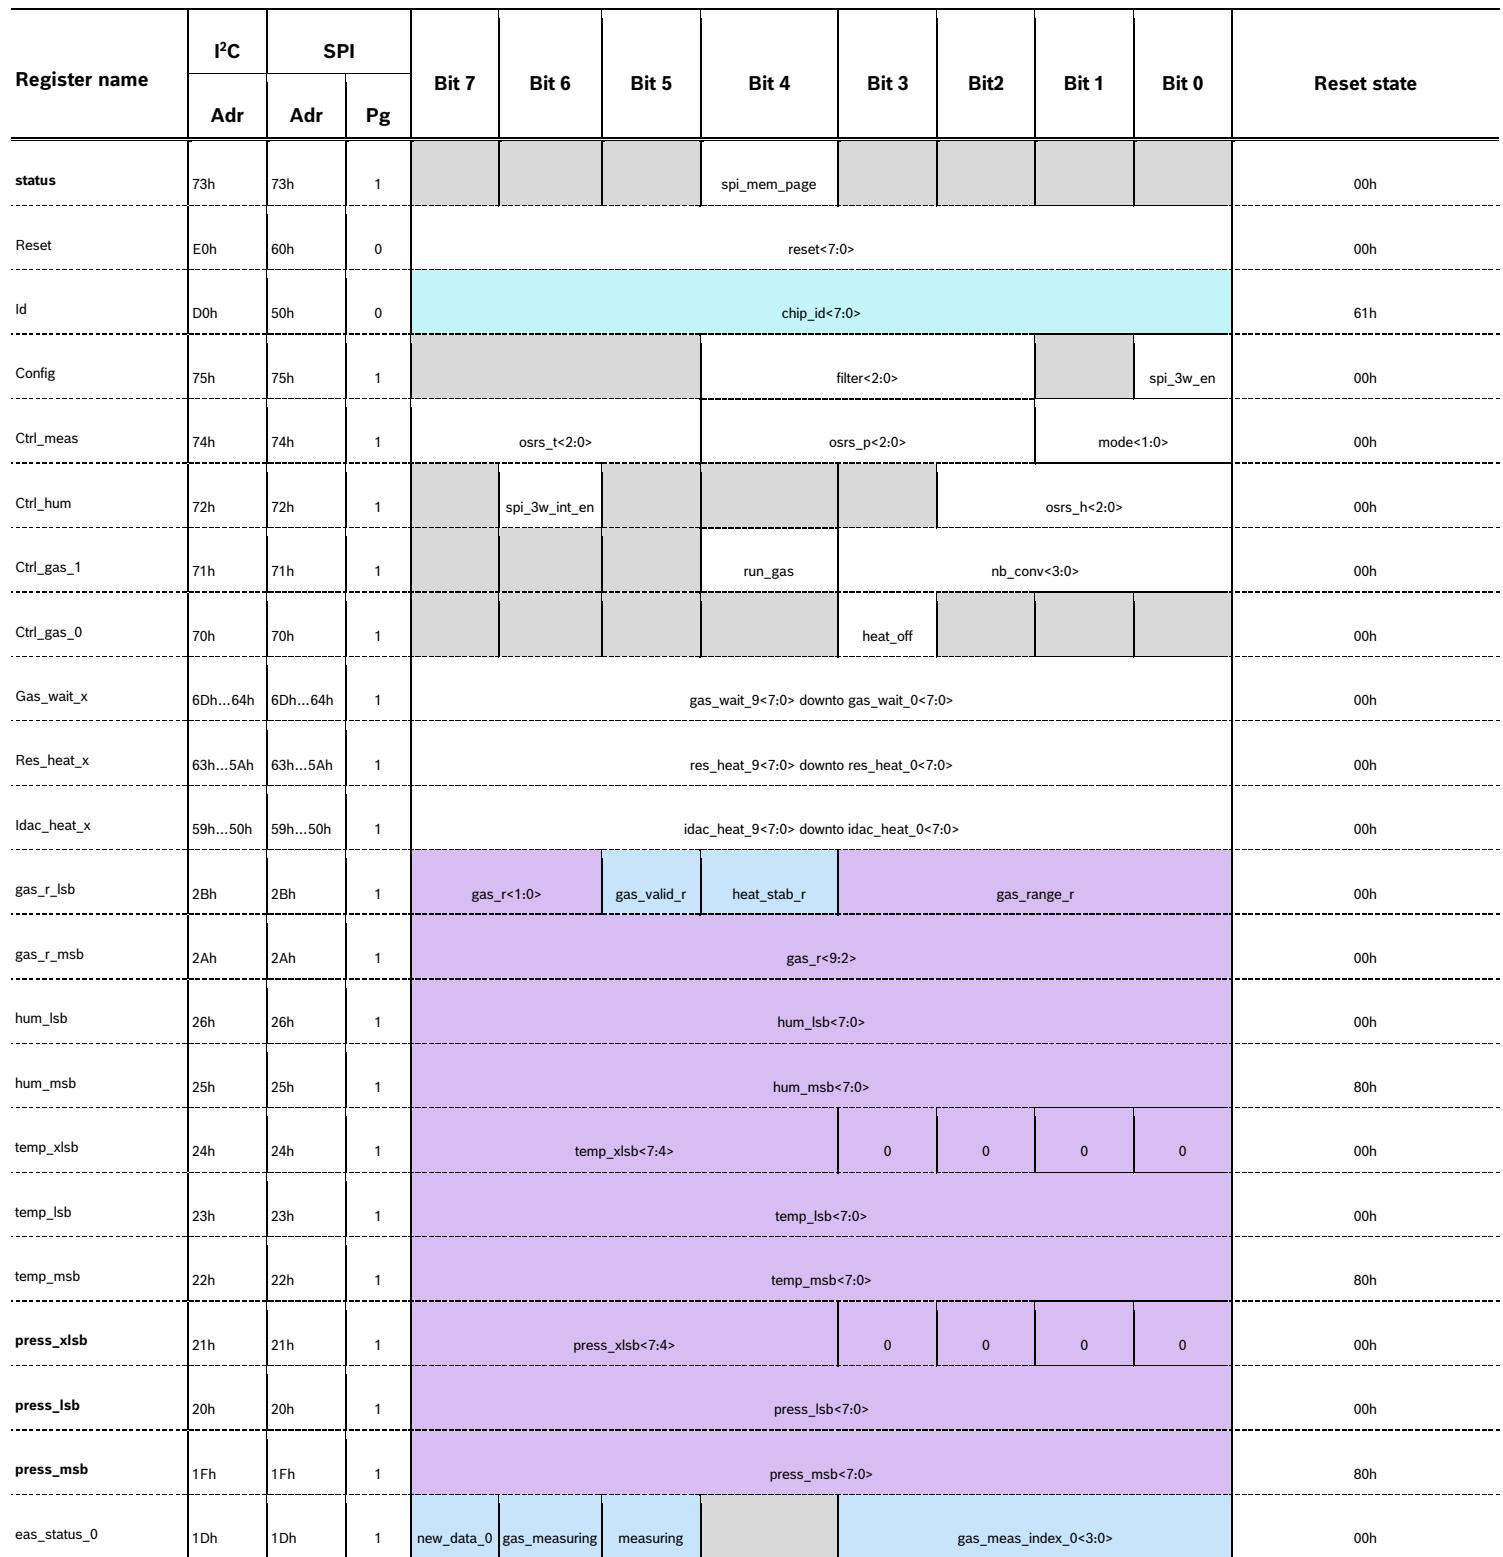

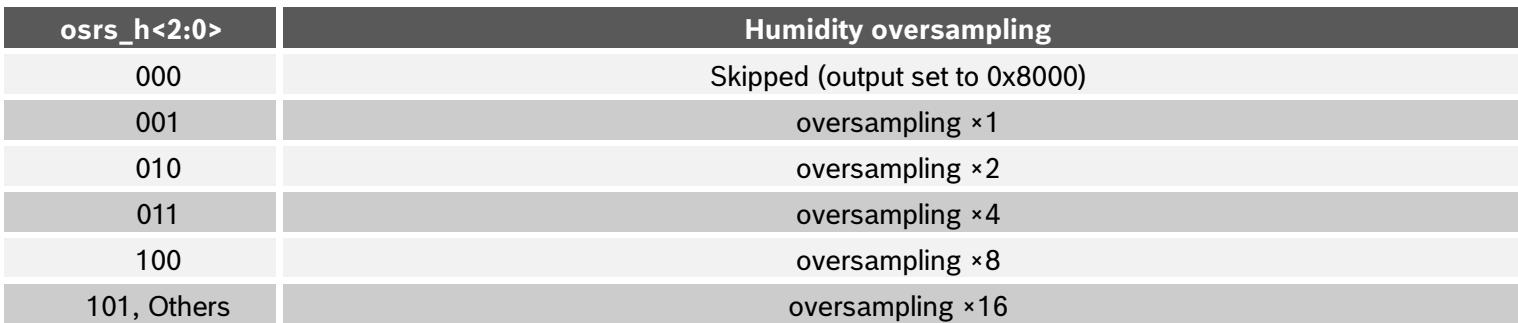
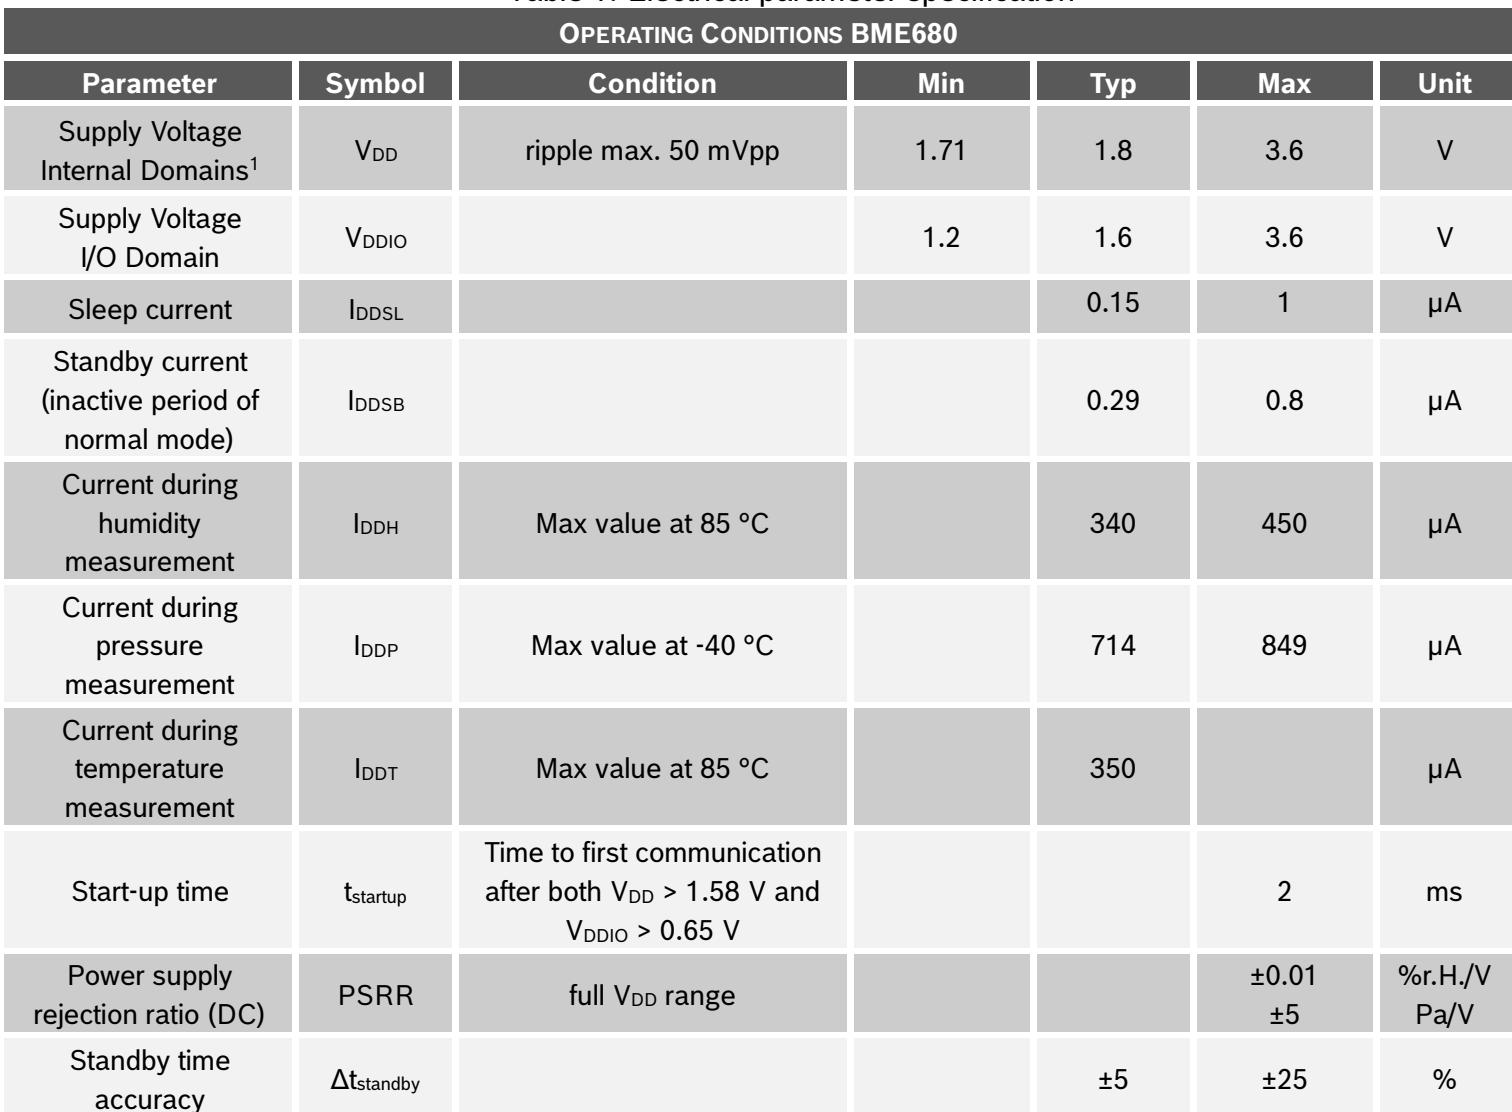



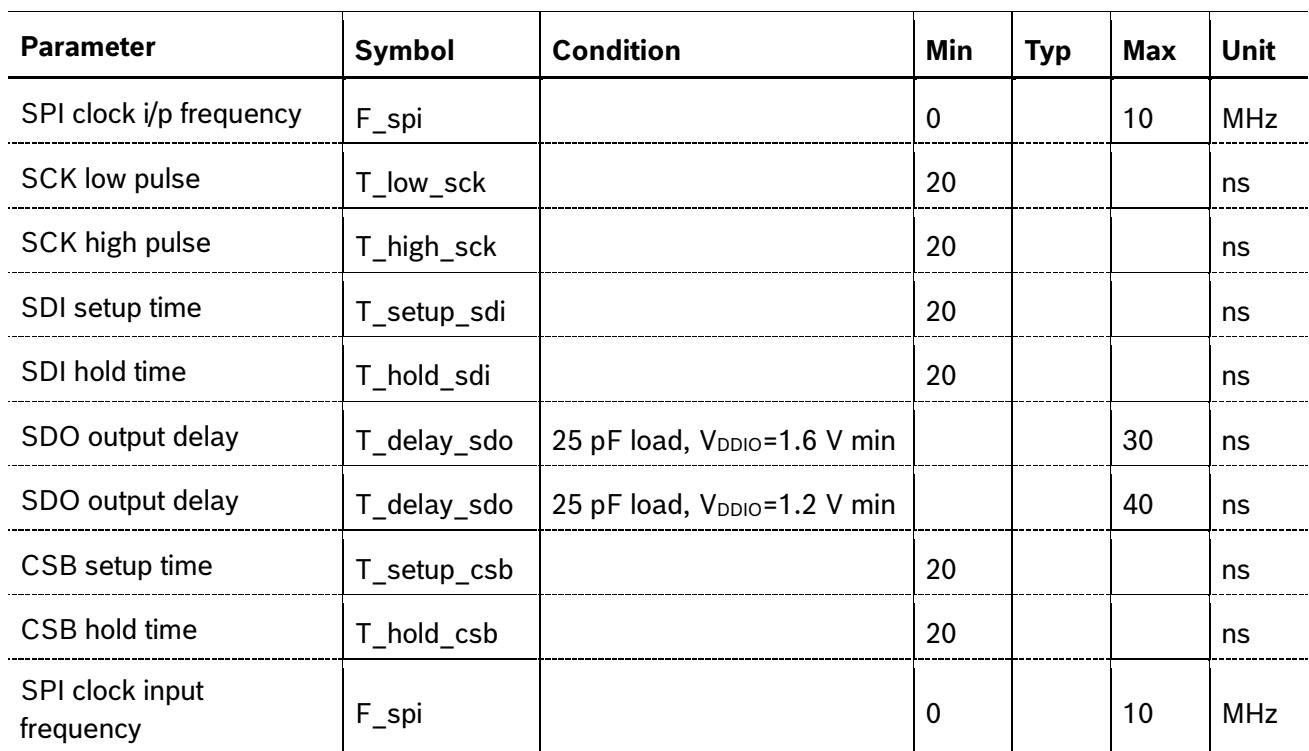
Use this datasheet from any agent
Send the page, markdown, chunks, or search endpoint to ChatGPT, Claude, embedr-app, or your own tooling.