
ADP7182AUJZ-5.0
-28V, -200mA, Low Noise, Linear Regulator
FEATURES
Low noise: 18 μV rms Power supply rejection ratio (PSRR): 66 dB at 10 kHz at V = −3 V Positive or negative enable logic Stable with small 2.2 μF ceramic output capacitor Input voltage range: −2.7 V to −28 V Maximum output current: −200 mA Low dropout voltage: −185 mV at −200 mA load Initial accuracy: ±1% Accuracy over line, load, and temperature +2% maximum/−3% minimum Low quiescent current, IGND = −650 μA with −200 mA load Low shutdown current: −2 μA Adjustable output from −1.22 V to −V + V Current-limit and thermal overload protection 6- and 8-lead LFCSP and 5-lead TSOT Supported by ADIsimPower tool
APPLICATIONS
Regulation to noise sensitive applications Analog-to-digital converter (ADC) and digital-to-analog converter (DAC) circuits, precision amplifiers Communications and infrastructure Medical and healthcare Industrial and instrumentation
GENERAL DESCRIPTION
The ADP7182 is a CMOS, low dropout (LDO) linear regulator that operates from −2.7 V to −28 V and provides up to −200 mA of output current. This high input voltage LDO is ideal for regulation of high performance analog and mixed signal circuits operating from −27 V down to −1.2 V rails. Using an advanced proprietary architecture, it provides high power supply rejection and low noise, and achieves excellent line and load transient response with a small 2.2 μF ceramic output capacitor.
The ADP7182 is available in fixed output voltage and an adjustable version that allows the output voltage to range from −1.22 V to −VIN + VDO via an external feedback divider.
TYPICAL APPLICATION CIRCUITS

Figure 1. ADP7182 with Fixed Output Voltage, VOUT = −5 V
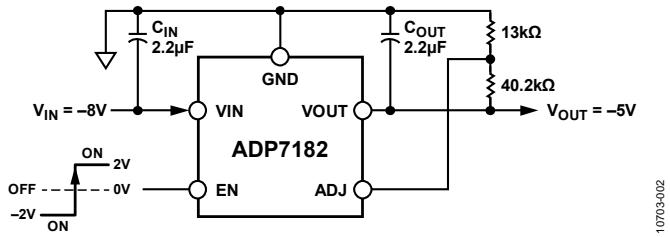
Figure 2. ADP7182 with Adjustable Output Voltage, VOUT = −5 V
The following fixed output voltages are available from stock: −5 V (3 mm × 3 mm LFCSP), −1.8 V, −2.5 V, −3 V, −5 V (TSOT), −1.2 V, −1.5 V, −2.5 V, −5 V (2.00 mm × 2.00 mm LFCSP). Additional voltages are available by special order.
The ADP7182 regulator output noise is 18 μV rms independent of the output voltage. The enable logic is capable of interfacing with positive or negative logic levels for maximum flexibility.
The ADP7182 is available in 5-lead TSOT, 6- and 8-lead LFCSP packages for a small, low profile footprint.
TABLE OF CONTENTS
TABLE OF CONTENTS
Features......1
Applications......1
Typical Application Circuits......1
General Description......1
Revision History......2
Specifications......4
Input and Output Capacitance, Recommended Specifications......5
Absolute Maximum Ratings......6
Thermal Data......6
Thermal Resistance......6
ESD Caution......6
Pin Configurations and Function Descriptions......7
Typical Performance Characteristics......10
REVISION HISTORY
6/2019—Rev. L to Rev. M
Changes to Adjustable Mode Operation Section......22
10/2018—Rev. K to Rev. L
Changes to Noise Reduction of the Adjustable ADP7182 Section......25
Changes to Ordering Guide......32
7/2018—Rev. J to Rev. K
Changes to Outline Dimensions......30
Changes to Ordering Guide......31
3/2017—Rev. I to Rev. J
Changes to Specifications Section......3
Updated Outline Dimensions......30
Changes to Ordering Guide......31
12/2016—Rev. H to Rev. I
Changes to Figure 77......21
Moved Theory of Operation/Enable Pin Operation Section......23
Changes to Enable Pin Operation Section......23
11/2016—Rev. G to Rev. H
Change to Thermal Considerations Section......25
Updated Outline Dimensions......30
Changes to Ordering Guide......31
6/2016—Rev. F to Rev. G
Changes to Figure 101......28
Theory of Operation....22
Adjustable Mode Operation....22
Applications Information....23
ADIsimPower Design Tool....23
Capacitor Selection....23
Enable Pin Operation....24
Soft Start....24
Noise Reduction of the Adjustable ADP7182....25
Current-Limit and Thermal Overload Protection....25
Thermal Considerations....26
PCB Layout Considerations....29
Outline Dimensions....31
Ordering Guide....32
3/2016—Rev. E to Rev. F
Changes to Figure 62....17
9/2014—Rev. D to Rev. E
Changes to Features and General Description Sections....1
Changes to Figure 101....28
Added Table 11....29
Changes to Ordering Guide....31
7/2014—Rev. C to Rev. D
Added 6-Lead LFCSP (Throughout)....1
Added 6-Lead LFCSP Thermal Resistance Parameters....5
Added Figure 7, Figure 8, and Table 7....8
Added 6-Lead LFCSP $\theta_{\mathrm{JA}}$ Values to Table 8; Added 6-Lead LFCSP $\Psi_{\mathrm{JB}}$ Value to Table 10....25
Added Figure 92, Figure 93, and Figure 94....26
Changes to Thermal Characterization Parameter, $\Psi_{\mathrm{JB}}$ Section and Added Figure 99....27
Added Figure 101....28
Added Figure 104, Outline Dimensions....29
Changes to Ordering Guide....30
9/2013—Rev. B to Rev. C
Changes to Ordering Guide....28
6/2013—Rev. A to Rev. B
Changes to General Description....1
Updated Outline Dimensions....27
Changes to Ordering Guide....28
5/2013—Rev. 0 to Rev. A
Changed Start-Up Time $V_{OUT} = -5$ V from 450 $\mu$ s to 550 $\mu$ s.....3
Changes to Figure 9 and Figure 12 .....8
Changes to Figure 13 .....9
Changes to Figure 19 and Figure 22 .....10
Changes to Figure 28 .....11
Changes to Figure 31 and Figure 34 .....12
Changes to Figure 37 and Figure 40 .....13
Changes to Figure 43 .....14
Added ADIsimPower Design Tool Section .....21
4/2013—Revision 0: Initial Version
SPECIFICATIONS
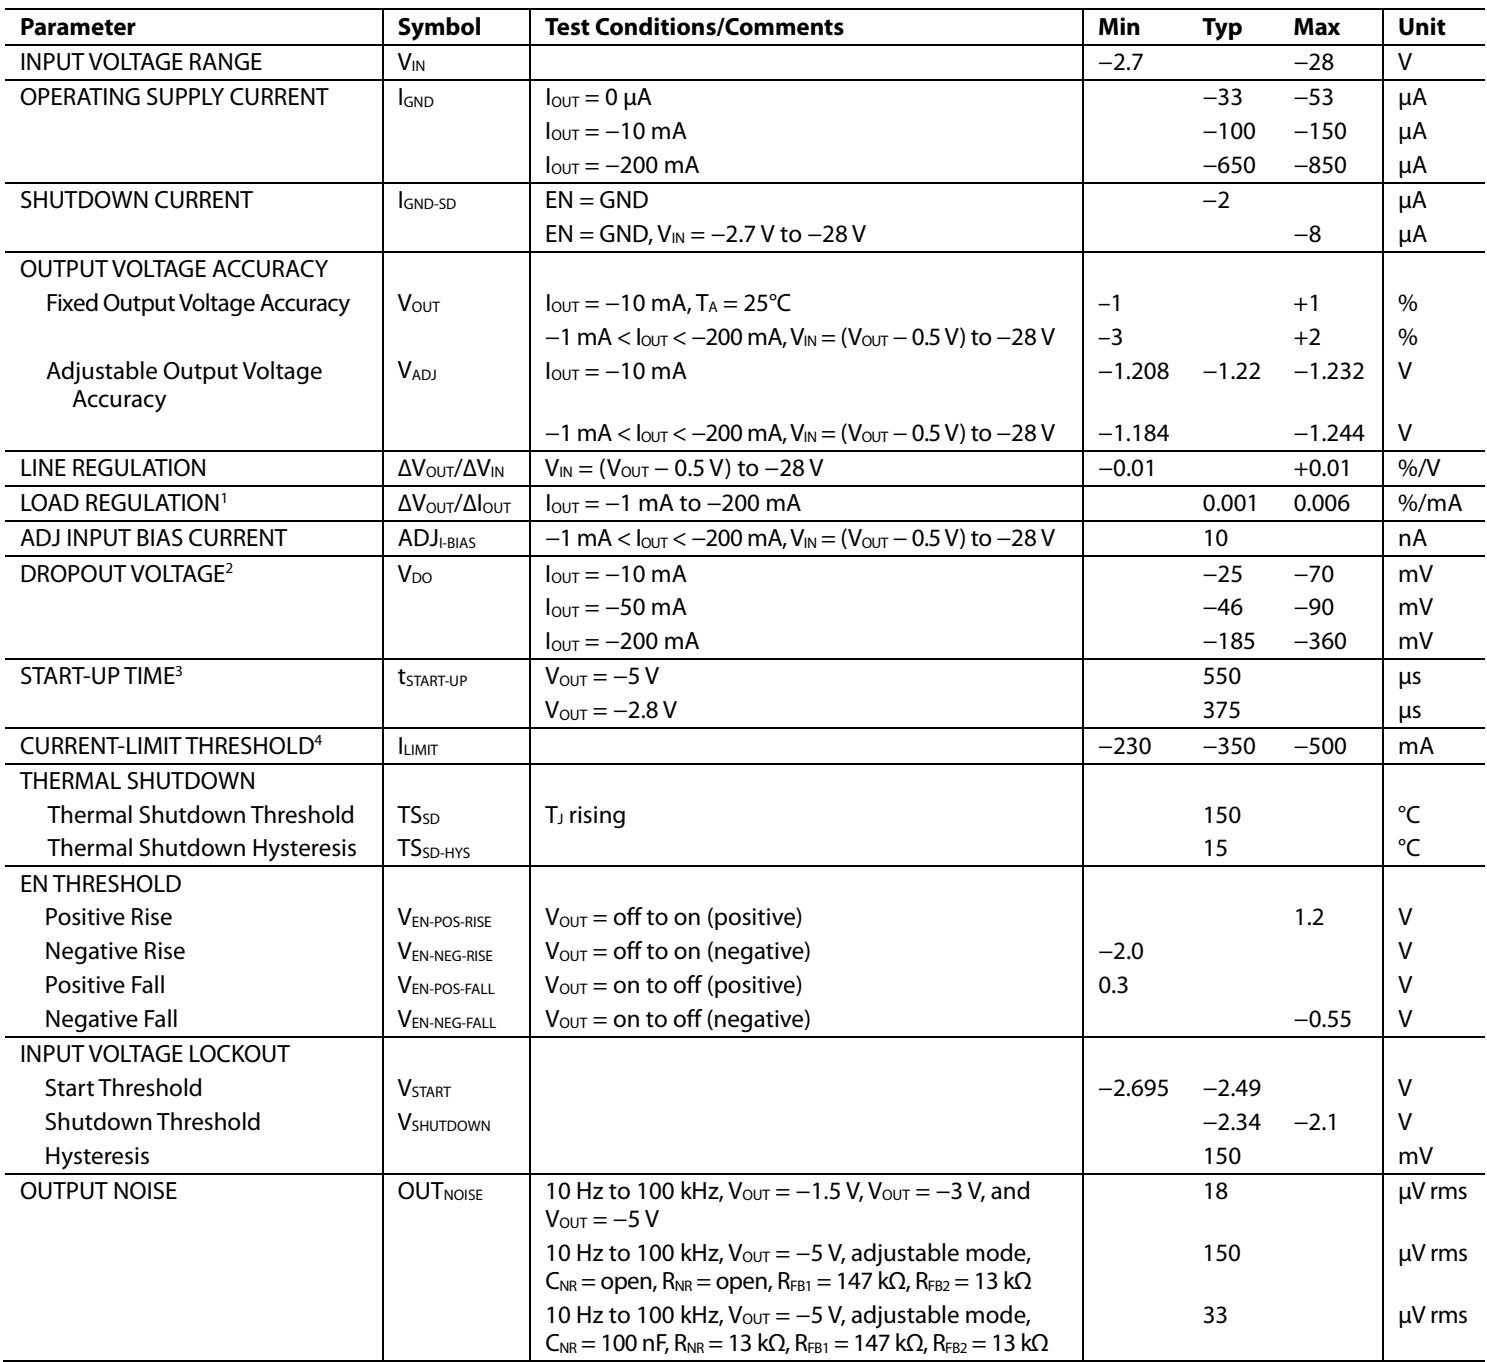
$\mathrm { V _ { I N } } = \left( \mathrm { V } _ { \mathrm { O U T } } - 0 . 5 \mathrm { V } \right) \mathrm { o r } - 2 . 7 \mathrm { V }$ (whichever is more negative), EN = VIN, IOUT = −10 mA, $\mathrm { C _ { I N } } = \mathrm { C _ { O U T } } = 2 . 2 \mu \mathrm { F } , \mathrm { T _ { J } } = - 4 0 ^ { \circ } \mathrm { C \ t o } + 1 2 5 ^ { \circ } \mathrm { C }$ for minimum/maximum specifications, $\mathrm { T } _ { \mathrm { A } } = 2 5 ^ { \circ } \mathrm { C }$ for typical specifications, unless otherwise noted.
Table 1.
| Parameter | Symbol | Test Conditions/Comments | Min | Typ | Max | Unit |
| INPUT VOLTAGE RANGE | $V_{IN}$ | -2.7 | -28 | V | ||
| OPERATING SUPPLY CURRENT | $I_{GND}$ | $I_{OUT}=0μA$ | -33 | -53 | μA | |
| $I_{OUT}=-10mA$ | -100 | -150 | μA | |||
| $I_{OUT}=-200mA$ | -650 | -850 | μA | |||
| SHUTDOWN CURRENT | $I_{GND-SD}$ | EN=GND | -2 | μA | ||
| EN=GND, $V_{IN}=-2.7V to -28V$ | -8 | μA | ||||
| OUTPUT VOLTAGE ACCURACY | ||||||
| Fixed Output Voltage Accuracy | $V_{OUT}$ | $I_{OUT}=-10mA, T_A=25°C$ | -1 | +1 | % | |
| -1 mA< $I_{OUT}< -200mA, V_{IN}=(V_{OUT}-0.5V)$ to-28V | -3 | +2 | % | |||
| Adjustable Output Voltage Accuracy | $V_{ADJ}$ | $I_{OUT}=-10mA$ | -1.208 | -1.22 | -1.232 | V |
| -1 mA< $I_{OUT}< -200mA, V_{IN}=(V_{OUT}-0.5V)$ to-28V | -1.184 | -1.244 | V | |||
| LINE REGULATION | $\Delta V_{OUT}/\Delta V_{IN}$ | $V_{IN}=(V_{OUT}-0.5V)$ to-28V | -0.01 | +0.01 | %/V | |
| $LOAD REGULATION^1$ | $\Delta V_{OUT}/\Delta I_{OUT}$ | $I_{OUT}=-1mA to -200mA$ | 0.001 | 0.006 | %/mA | |
| ADJ INPUT BIAS CURRENT | $ADJ_{I-BIAS}$ | -1 mA< $I_{OUT}< -200mA, V_{IN}=(V_{OUT}-0.5V)$ to-28V | 10 | nA | ||
| $DROPOUT\ VOLTAGE^2$ | $V_{DO}$ | $I_{OUT}=-10mA$ | -25 | -70 | mV | |
| $I_{OUT}=-50mA$ | -46 | -90 | mV | |||
| $I_{OUT}=-200mA$ | -185 | -360 | mV | |||
| $START-UP\ TIME^3$ | $t_{START-UP}$ | $V_{OUT}=-5V$ | 550 | μs | ||
| $V_{OUT}=-2.8V$ | 375 | μs | ||||
| $CURRENT-LIMIT\ THRESHOLD^4$ | $I_{LIMIT}$ | -230 | -350 | -500 | mA | |
| THERMAL SHUTDOWN | ||||||
| Thermal Shutdown Threshold | $TS_{SD}$ | $T_J rising$ | 150 | °C | ||
| Thermal Shutdown Hysteresis | $TS_{SD-HYS}$ | 15 | °C | |||
| EN THRESHOLD | ||||||
| Positive Rise | $V_{EN-POS-RISE}$ | $V_{OUT}=off to on (positive)$ | 1.2 | V | ||
| Negative Rise | $V_{EN-NEG-RISE}$ | $V_{OUT}=off to on (negative)$ | -2.0 | V | ||
| Positive Fall | $V_{EN-POS-FALL}$ | $V_{OUT}=on to off (positive)$ | 0.3 | V | ||
| Negative Fall | $V_{EN-NEG-FALL}$ | $V_{OUT}=on to off (negative)$ | -0.55 | V | ||
| INPUT VOLTAGE LOCKOUT | ||||||
| Start Threshold | $V_{START}$ | -2.695 | -2.49 | V | ||
| Shutdown Threshold | $V_{SHUTDOWN}$ | -2.34 | -2.1 | V | ||
| Hysteresis | 150 | mV | ||||
| OUTPUT NOISE | $OUT_{NOISE}$ | 10 Hz to 100 kHz, $V_{OUT}=-1.5V, V_{OUT}=-3V, and V_{OUT}=-5V$ | 18 | μV rms | ||
| 10 Hz to 100 kHz, $V_{OUT}=-5V, adjustable mode, C_{NR}=open, R_{NR}=open, R_{FB1}=147kΩ, R_{FB2}=13kΩ$ | 150 | μV rms | ||||
| 10 Hz to 100 kHz, $V_{OUT}=-5V, adjustable mode, C_{NR}=100nF, R_{NR}=13kΩ, R_{FB1}=147kΩ, R_{FB2}=13kΩ$ | 33 | μV rms | ||||
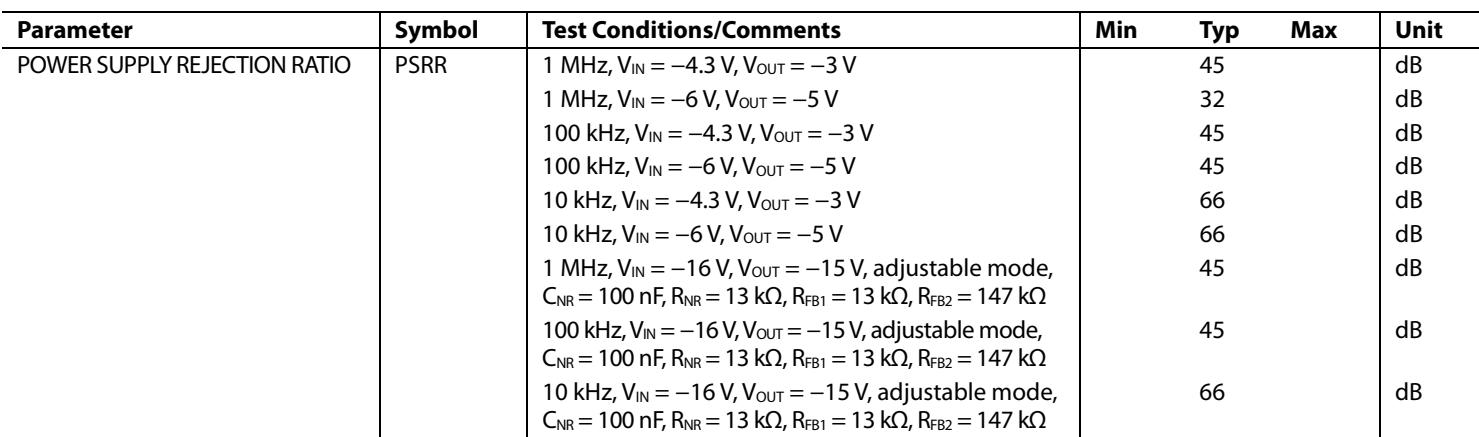
| POWER SUPPLY REJECTION RATIO | PSRR | 1 MHz, $V_{IN} = -4.3$ V, $V_{OUT} = -3$ V | 45 | dB | ||
| 1 MHz, $V_{IN} = -6$ V, $V_{OUT} = -5$ V | 32 | dB | ||||
| 100 kHz, $V_{IN} = -4.3$ V, $V_{OUT} = -3$ V | 45 | dB | ||||
| 100 kHz, $V_{IN} = -6$ V, $V_{OUT} = -5$ V | 45 | dB | ||||
| 10 kHz, $V_{IN} = -4.3$ V, $V_{OUT} = -3$ V | 66 | dB | ||||
| 10 kHz, $V_{IN} = -6$ V, $V_{OUT} = -5$ V | 66 | dB | ||||
| 1 MHz, $V_{IN} = -16$ V, $V_{OUT} = -15$ V, adjustable mode, $C_{NR} = 100$ nF, $R_{NR} = 13$ kΩ, $R_{FB1} = 13$ kΩ, $R_{FB2} = 147$ kΩ | 45 | dB | ||||
| 100 kHz, $V_{IN} = -16$ V, $V_{OUT} = -15$ V, adjustable mode, $C_{NR} = 100$ nF, $R_{NR} = 13$ kΩ, $R_{FB1} = 13$ kΩ, $R_{FB2} = 147$ kΩ | 45 | dB | ||||
| 10 kHz, $V_{IN} = -16$ V, $V_{OUT} = -15$ V, adjustable mode, $C_{NR} = 100$ nF, $R_{NR} = 13$ kΩ, $R_{FB1} = 13$ kΩ, $R_{FB2} = 147$ kΩ | 66 | dB | ||||
1 Based on an endpoint calculation using −1 mA and −200 mA loads. See Figure 10 for the typical load regulation performance for loads less than 1 mA.
2 Dropout voltage is defined as the input-to-output voltage differential when the input voltage is set to the nominal output voltage. This applies only for output voltages below −3 V.
3 Start-up time is defined as the time between the rising edge of EN to VOUT being at 90% of the nominal value.
4 Current-limit threshold is defined as the current at which the output voltage drops to 90% of the specified typical value. For example, the current limit for $\mathsf { a } - 5 \mathsf { V }$ output voltage is defined as the current that causes the output voltage to drop to 90% $\mathsf { o f } - 5 \mathsf { V } , \mathsf { o r } - 4 . 5 \mathsf { V } .$
INPUT AND OUTPUT CAPACITANCE, RECOMMENDED SPECIFICATIONS
Table 2.
| Parameter | Symbol | Test Conditions/Comments | Min | Typ | Max | Unit |
| INPUT AND OUTPUT CAPACITANCE | ||||||
| Minimum Capacitance1 | $C_{MIN}$ | $T_A = -40°C to +125°C$ | 1.5 | 2.2 | μF | |
| Capacitor Effective Series Resistance (ESR) | $R_{ESR}$ | $T_A = -40°C to +125°C$ | 0.001 | 0.2 | Ω | |
1 The minimum input and output capacitance must be greater than 1.5 μF over the full range of operating conditions. The full range of operating conditions in the application must be considered during device selection to ensure that the minimum capacitance specification is met. X7R and X5R type capacitors are recommended; Y5V and Z5U capacitors are not recommended for use with any LDO.
ABSOLUTE MAXIMUM RATINGS
Table 3.
| Parameter | Rating |
| VIN to GND | +0.3 V to -30 V |
| VOUT to GND | 0.3 V to VIN |
| EN to GND | 5 V to VIN |
| EN to VIN | +30 V to -0.3 V |
| ADJ to GND | +0.3 V to VOUT |
| Storage Temperature Range | -65°C to +150°C |
| Operating Junction Temperature Range | -40°C to +125°C |
| Operating Ambient Temperature Range | -40°C to +85°C |
| Soldering Conditions | JEDEC J-STD-020 |
Stresses at or above those listed under Absolute Maximum Ratings may cause permanent damage to the product. This is a stress rating only; functional operation of the product at these or any other conditions above those indicated in the operational section of this specification is not implied. Operation beyond the maximum operating conditions for extended periods may affect product reliability.
THERMAL DATA
Absolute maximum ratings apply individually only, not in combination. The ADP7182 can be damaged when the junction temperature limits are exceeded. Monitoring ambient temperature does not guarantee that junction temperature (TJ) is within the specified temperature limits. In applications with high power dissipation and poor thermal resistance, the maximum ambient temperature may have to be derated.
In applications with moderate power dissipation and low printed circuit board (PCB) thermal resistance, the maximum ambient temperature can exceed the maximum limit as long as the junction temperature is within specification limits. The TJ of the device is dependent on the ambient temperature $( \mathrm { T _ { A } } ) ,$ , the power dissipation of the device (PD), and the junction-to-ambient thermal resistance of the package (θJA).
Maximum $\mathrm { T } _ { \mathrm { J } }$ is calculated from the $\mathrm { T _ { A } }$ and $\mathrm { P _ { D } }$ using the formula
$$
T _ {J} = T _ {A} + (P _ {D} \times \theta_ {J A})
$$
Junction-to-ambient thermal resistance $( \theta _ { \mathrm { J A } } )$ of the package is based on modeling and calculation using a 4-layer board. The junction-to-ambient thermal resistance is highly dependent on the application and board layout.
In applications where high maximum power dissipation exists, close attention to thermal board design is required. The value of $\theta _ { \mathrm { J A } }$ can vary, depending on PCB material, layout, and environmental conditions. The specified values of $\mathsf { \partial _ { \theta _ { J A } } }$ are based on a 4-layer, 4 in. × 3 in. circuit board. See JESD51-7 and JESD51-9 for detailed information on the board construction. For additional information, see the AN-617 Application Note, MicroCSP™ Wafer Level Chip Scale Package.
$\Psi _ { \mathrm { J B } }$ is the junction-to-board thermal characterization parameter with units of °C/W. ΨJB of the package is based on modeling and calculation using a 4-layer board. The JESD51-12, Guidelines for Reporting and Using Electronic Package Thermal Information, states that thermal characterization parameters are not the same as thermal resistances. $\Psi _ { \mathrm { J B } }$ measures the component power flowing through multiple thermal paths rather than a single path as in thermal resistance, $\theta _ { \mathrm { J B } } .$ Therefore, $\Psi _ { \mathrm { J B } }$ thermal paths include convection from the top of the package as well as radiation from the package, factors that make $\Psi _ { \mathrm { J B } }$ more useful in real-world applications. Maximum junction temperature is calculated from the board temperature (TB) and power dissipation using the formula
$$
T _ {J} = T _ {B} + \left(P _ {D} \times \Psi_ {J B}\right)
$$
See JESD51-8 and JESD51-12 for more detailed information about $\Psi _ { \mathrm { J B } }$
THERMAL RESISTANCE
θJA, θJC, and ΨJB are specified for the worst-case conditions, that is, a device soldered in a circuit board for surface-mount packages.
Table 4. Thermal Resistance
| Package Type | $\theta_{JA}$ | $\theta_{JC}$ | $\Psi_{JB}$ | Unit |
| 8-Lead LFCSP | 50.2 | 31.7 | 18.2 | °C/W |
| 6-Lead LFCSP | 68.9 | 42.29 | 44.1 | °C/W |
| 5-Lead TSOT | 170 | Not applicable | 43 | °C/W |
ESD CAUTION

ESD (electrostatic discharge) sensitive device. Charged devices and circuit boards can discharge without detection. Although this product features patented or proprietary protection circuitry, damage may occur on devices subjected to high energy ESD. Therefore, proper ESD precautions should be taken to avoid performance degradation or loss of functionality
PIN CONFIGURATIONS AND FUNCTION DESCRIPTIONS
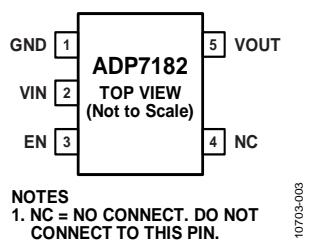
Figure 3. 5-Lead TSOT Pin Configuration, Fixed Output Voltage

Figure 4. 5-Lead TSOT Pin Configuration, Adjustable Output Voltage
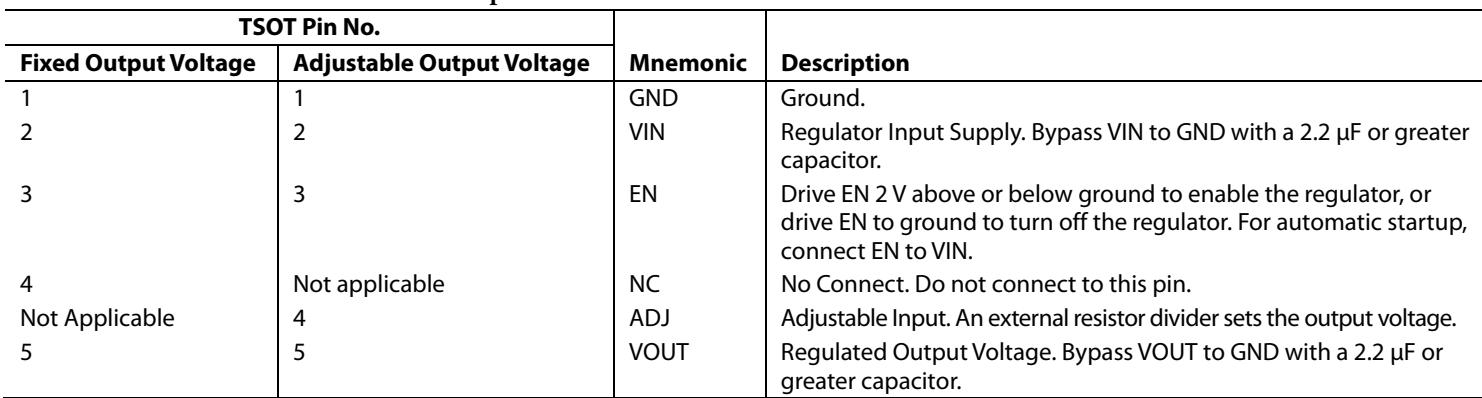
Table 5. 5-Lead TSOT Pin Function Descriptions
| TSOT Pin No. | Mnemonic | Description | |
| Fixed Output Voltage | Adjustable Output Voltage | ||
| 1 | 1 | GND | Ground. |
| 2 | 2 | VIN | Regulator Input Supply. Bypass VIN to GND with a 2.2 μF or greater capacitor. |
| 3 | 3 | EN | Drive EN 2 V above or below ground to enable the regulator, or drive EN to ground to turn off the regulator. For automatic startup, connect EN to VIN. |
| 4 | Not applicable | NC | No Connect. Do not connect to this pin. |
| Not Applicable | 4 | ADJ | Adjustable Input. An external resistor divider sets the output voltage. |
| 5 | 5 | VOUT | Regulated Output Voltage. Bypass VOUT to GND with a 2.2 μF or greater capacitor. |
NOTES
NC = NO CONNECT. DO NOT CONNECT TO THIS PIN.
THE EXPOSED PAD ON THE BOTTOM OF THE LFCSP PACKAGE ENHANCESTHERMAL PERFORMANCE AND IS ELECTRICALLY CONNECTED TO VININSIDE THE PACKAGE. THE EXPOSED PAD MUST BE CONNECTED TO THEVIN PLANE ON THE BOARD FOR PROPER OPERATION. BECAUSE THIS IS A 10703-005NEGATIVE VOLTAGE REGULATOR, VIN IS THE MOST NEGATIVE POTENTIALIN THE CIRCUIT.
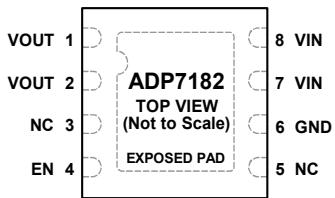
Figure 5. 8-Lead LFCSP Pin Configuration, Fixed Output Voltage
NOTES
NC = NO CONNECT. DO NOT CONNECT TO THIS PIN.
THE EXPOSED PAD ON THE BOTTOM OF THE LFCSP PACKAGE ENHANCESTHERMAL PERFORMANCE AND IS ELECTRICALLY CONNECTED TO VININSIDE THE PACKAGE. THE EXPOSED PAD MUST BE CONNECTED TO THEVIN PLANE ON THE BOARD FOR PROPER OPERATION. BECAUSE THIS IS A NEGATIVE VOLTAGE REGULATOR, VIN IS THE MOST NEGATIVE POTENTIAL 10703-006IN THE CIRCUIT.
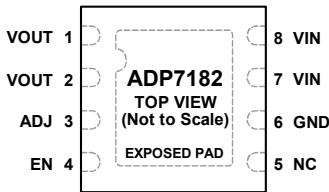
Figure 6. 8-Lead LFCSP Pin Configuration, Adjustable Output Voltage
Table 6. 8-Lead LFCSP Pin Function Descriptions
| LFCSP Pin No. | Mnemonic | Description | |
| Fixed Output Voltage | Adjustable Output Voltage | ||
| 1, 2 | 1, 2 | VOUT | Regulated Output Voltage. Bypass VOUT to GND with a 2.2 μF or greater capacitor. |
| Not Applicable | 3 | ADJ | Adjustable Input. An external resistor divider sets the output voltage. |
| 3 | Not applicable | NC | No Connect. Do not connect to this pin. |
| 4 | 4 | EN | Drive EN 2 V above or below ground to enable the regulator, or drive EN to ground to turn off the regulator. For automatic startup, connect EN to VIN. |
| 5 | 5 | NC | No Connect. Do not connect to this pin. |
| 6 | 6 | GND | Ground. |
| 7, 8 | 7, 8 | VIN | Regulator Input Supply. Bypass VIN to GND with a 2.2 μF or greater capacitor. |
| 9 | 9 | EPAD | Exposed pad. The exposed pad on the bottom of the LFCSP package enhances thermal performance and is electrically connected to VIN inside the package. The exposed pad must be connected to the VIN plane on the board for proper operation. Because this is a negative voltage regulator, VIN is the most negative potential in the circuit. |

NOTES
NC = NO CONNECT. DO NOT CONNECT TO THIS PIN.
THE EXPOSED PAD ON THE BOTTOM OF THE LFCSP PACKAGE ENHANCESTHERMAL PERFORMANCE AND IS ELECTRICALLY CONNECTED TO VININSIDE THE PACKAGE. THE EXPOSED PAD MUST BE CONNECTED TO THEVIN PLANE ON THE BOARD FOR PROPER OPERATION. BECAUSE THIS IS A 10703-107NEGATIVE VOLTAGE REGULATOR, VIN IS THE MOST NEGATIVE POTENTIALIN THE CIRCUIT.
Figure 7. 6-Lead LFCSP Pin Configuration, Fixed Output Voltage

NOTES
NC = NO CONNECT. DO NOT CONNECT TO THIS PIN.
THE EXPOSED PAD ON THE BOTTOM OF THE LFCSP PACKAGE ENHANCESTHERMAL PERFORMANCE AND IS ELECTRICALLY CONNECTED TO VININSIDE THE PACKAGE. THE EXPOSED PAD MUST BE CONNECTED TO THEVIN PLANE ON THE BOARD FOR PROPER OPERATION. BECAUSE THIS IS A 10703-106NEGATIVE VOLTAGE REGULATOR, VIN IS THE MOST NEGATIVE POTENTIALIN THE CIRCUIT.
Figure 8. 6-Lead LFCSP Pin Configuration, Adjustable Output Voltage
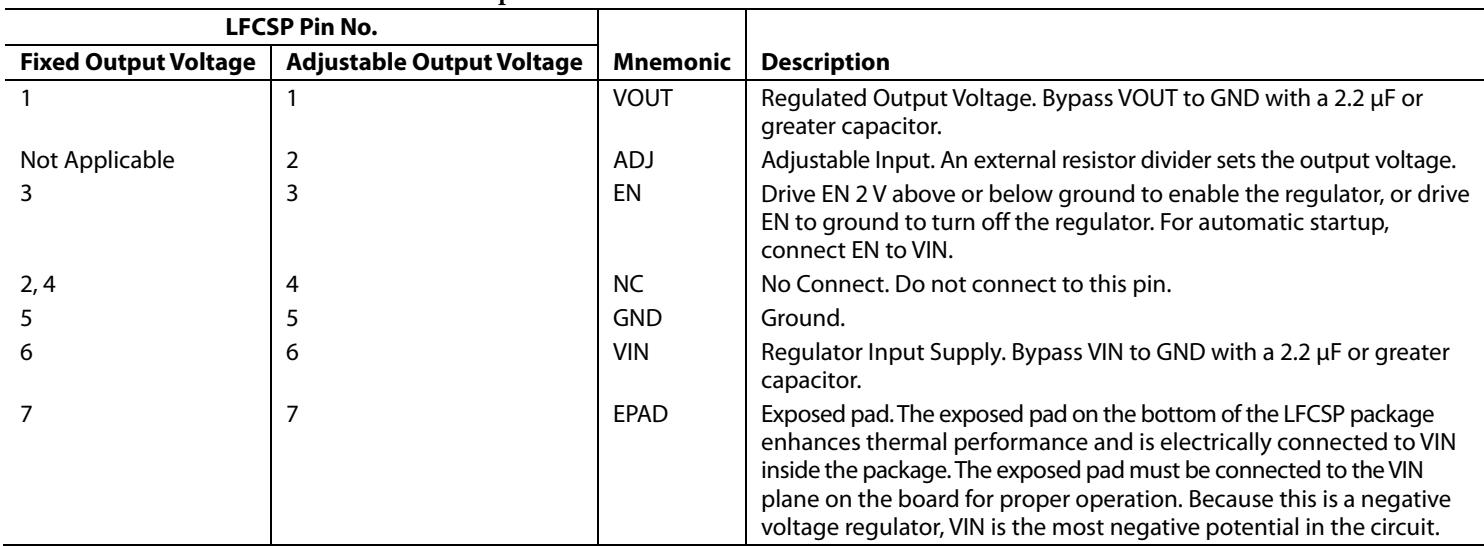
Table 7. 6-Lead LFCSP Pin Function Descriptions
| LFCSP Pin No. | Mnemonic | Description | |
| Fixed Output Voltage | Adjustable Output Voltage | ||
| 1 | 1 | VOUT | Regulated Output Voltage. Bypass VOUT to GND with a 2.2 μF or greater capacitor. |
| Not Applicable | 2 | ADJ | Adjustable Input. An external resistor divider sets the output voltage. |
| 3 | 3 | EN | Drive EN 2 V above or below ground to enable the regulator, or drive EN to ground to turn off the regulator. For automatic startup, connect EN to VIN. |
| 2,4 | 4 | NC | No Connect. Do not connect to this pin. |
| 5 | 5 | GND | Ground. |
| 6 | 6 | VIN | Regulator Input Supply. Bypass VIN to GND with a 2.2 μF or greater capacitor. |
| 7 | 7 | EPAD | Exposed pad. The exposed pad on the bottom of the LFCSP package enhances thermal performance and is electrically connected to VIN inside the package. The exposed pad must be connected to the VIN plane on the board for proper operation. Because this is a negative voltage regulator, VIN is the most negative potential in the circuit. |
TYPICAL PERFORMANCE CHARACTERISTICS
VIN = −3.5 V, VOUT = −3 V, IOUT = −10 mA, $\mathrm { C } _ { \mathrm { I N } } = \mathrm { C } _ { \mathrm { O U T } } = 2 . 2$ μF, $\mathrm { T _ { A } } = 2 5 ^ { \circ } \mathrm { C } ,$ unless otherwise noted.
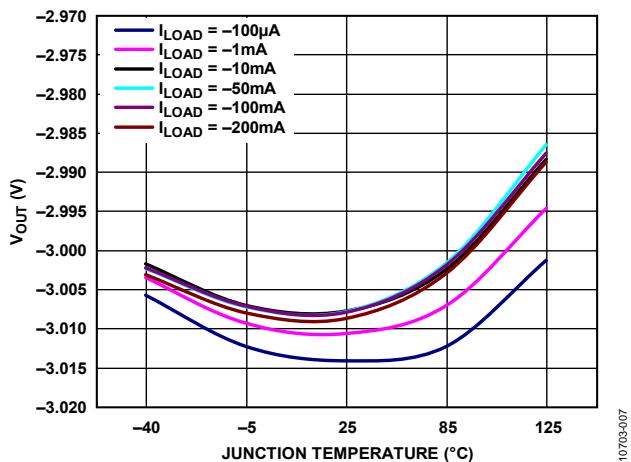

Figure 9. Output Voltage (VOUT) vs. Junction Temperature (TJ)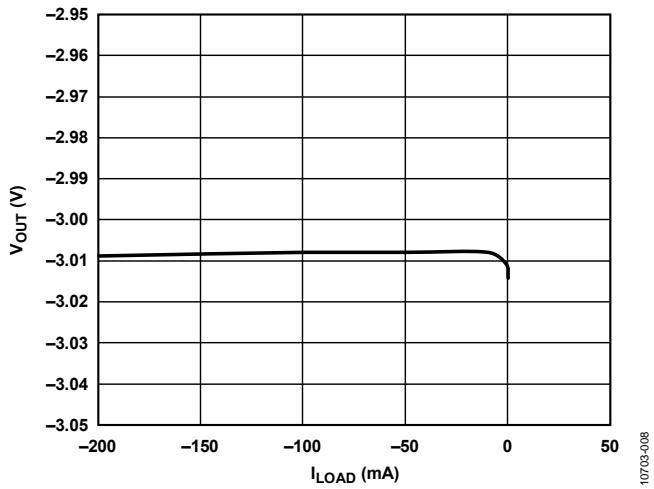
Figure 10. Output Voltage (VOUT) vs. Load Current (ILOAD)
Figure 12. Ground Current vs. Junction Temperature (TJ)
Figure 13. Ground Current vs. Load Current (ILOAD)

Figure 11. Output Voltage (VOUT) vs. Input Voltage (VIN)
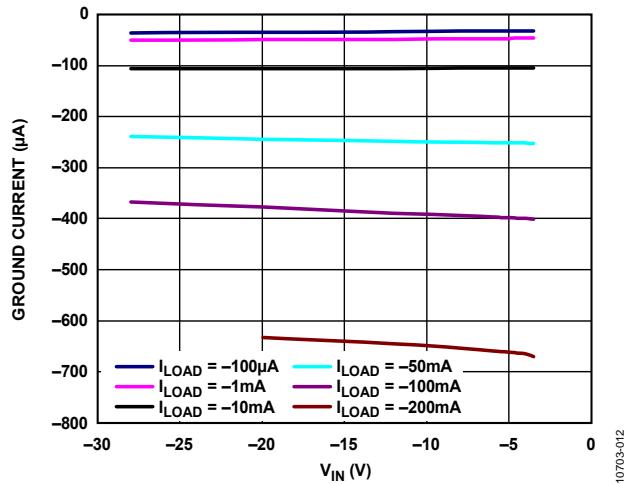
Figure 14. Ground Current vs. Input Voltage (VIN)

Figure 15. Shutdown Current vs. Temperature at Various Input Voltages

Figure 18. Ground Current vs. Input Voltage (VIN) in Dropout
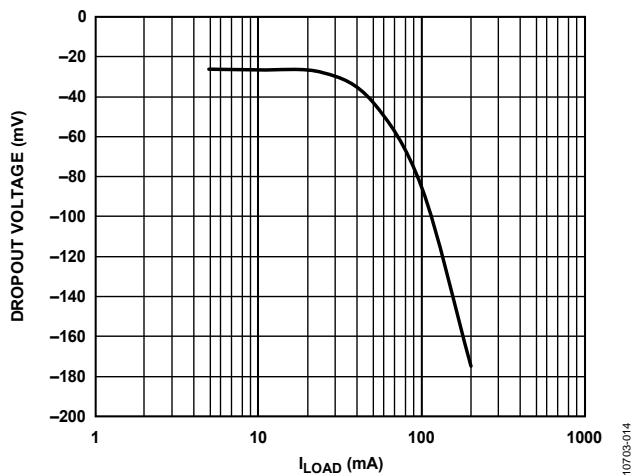
Figure 16. Dropout Voltage vs. Load Current (ILOAD)

Figure 19. Output Voltage (VOUT) vs. Junction Temperature (TJ), VOUT = −5 V

Figure 17. Output Voltage (VOUT) vs. Input Voltage (VIN) in Dropout

Figure 20. Output Voltage (VOUT) vs. Load Current (ILOAD), VOUT = −5 V

Figure 21. Output Voltage (VOUT) vs. Input Voltage (VIN), VOUT = −5 V
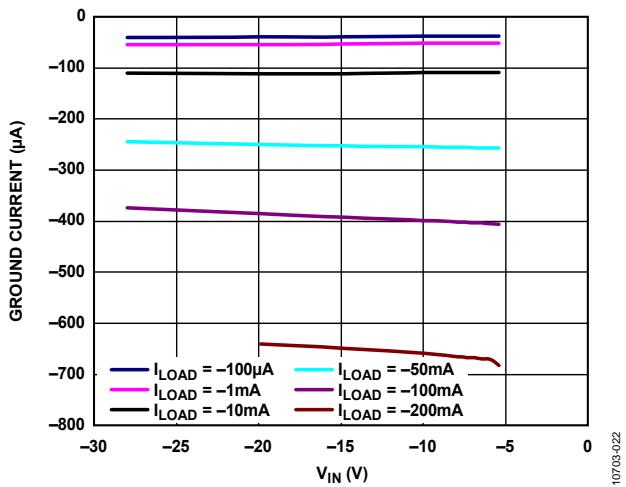
Figure 24. Ground Current vs. Input Voltage (VIN), VOUT = −5 V

Figure 22. Ground Current vs. Junction Temperature $( T _ { J } ) , V _ { O U T } = - 5 V$

Figure 25. Dropout Voltage vs. Load Current (ILOAD), VOUT = −5 V
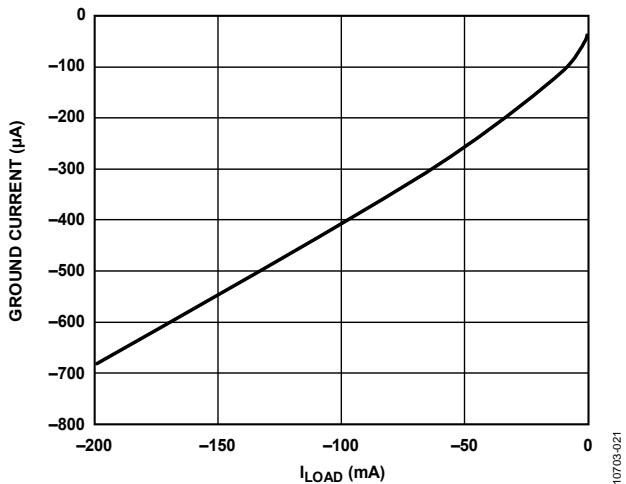
Figure 23. Ground Current vs. Load Current (ILOAD), VOUT = −5 V

Figure 26. Output Voltage (VOUT) vs. Input Voltage (VIN) in Dropout, VOUT = −5 V
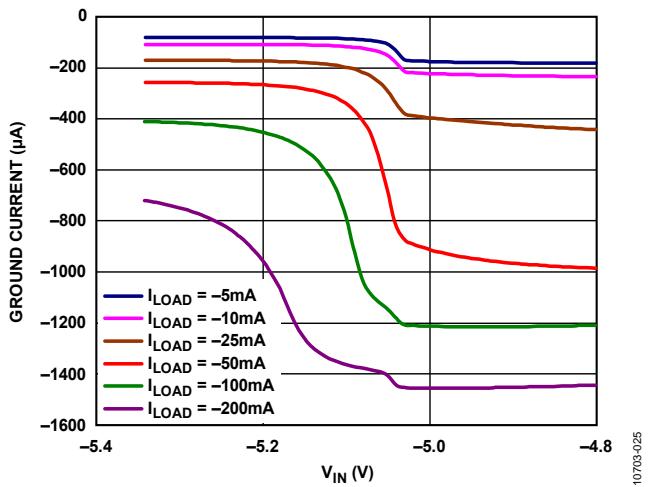
Figure 27. Ground Current vs. Input Voltage (VIN) in Dropout, $V _ { O U T } = - 5 V$
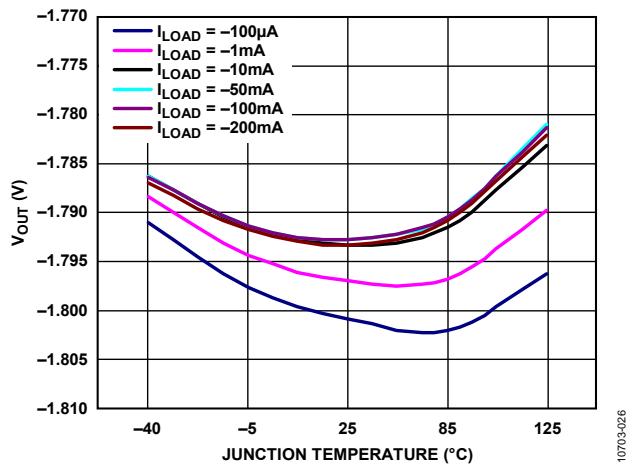
Figure 28. Output Voltage (VOUT) vs. Junction Temperature (TJ), VOUT = −1.8 V
Figure 29. Output Voltage (VOUT) vs. Load Current (ILOAD), VOUT = −1.8 V
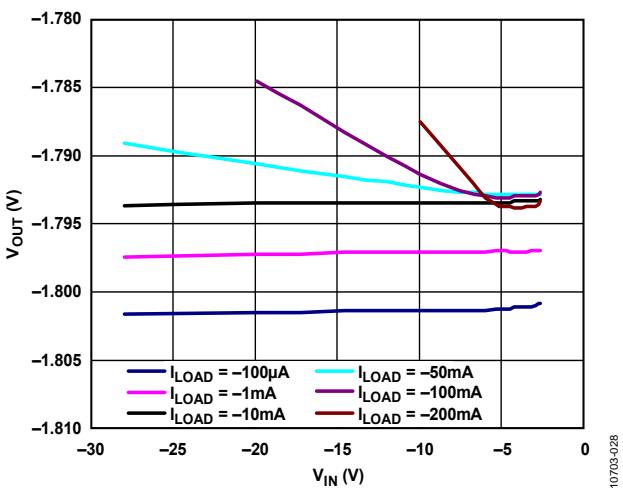
Figure 30. Output Voltage (VOUT) vs. Input Voltage (VIN), VOUT = −1.8 V
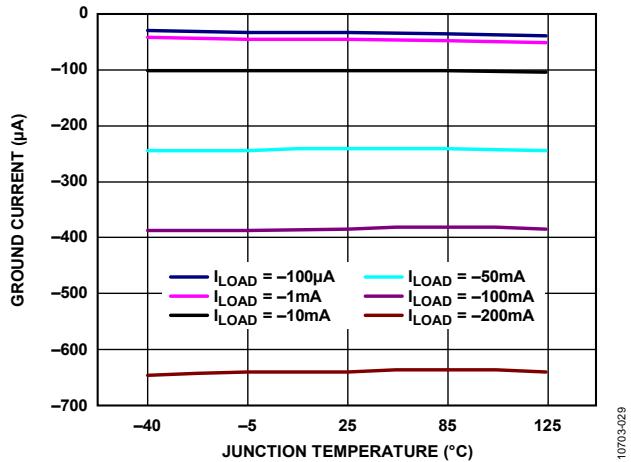
Figure 31. Ground Current vs. Junction Temperature (TJ), VOUT = −1.8 V
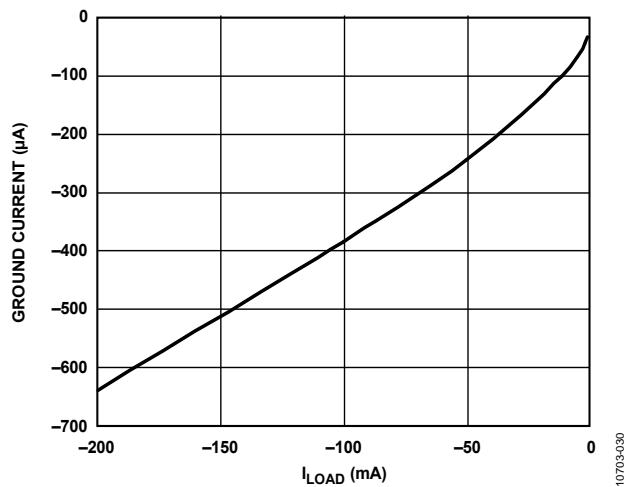
Figure 32. Ground Current vs. Load Current (ILOAD), VOUT = −1.8 V
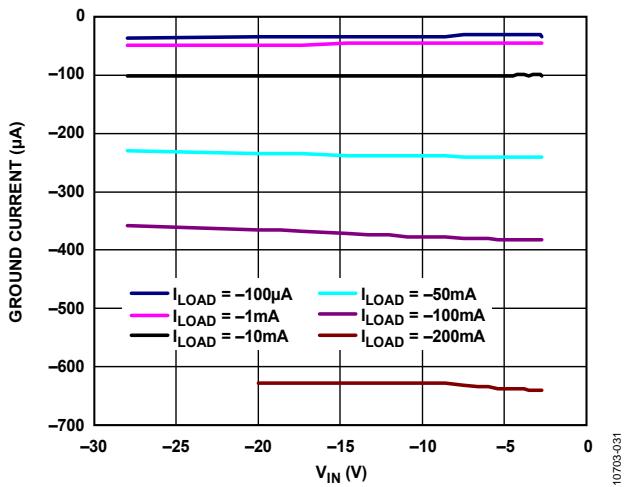
Figure 33. Ground Current vs. Input Voltage (VIN), VOUT = −1.8 V
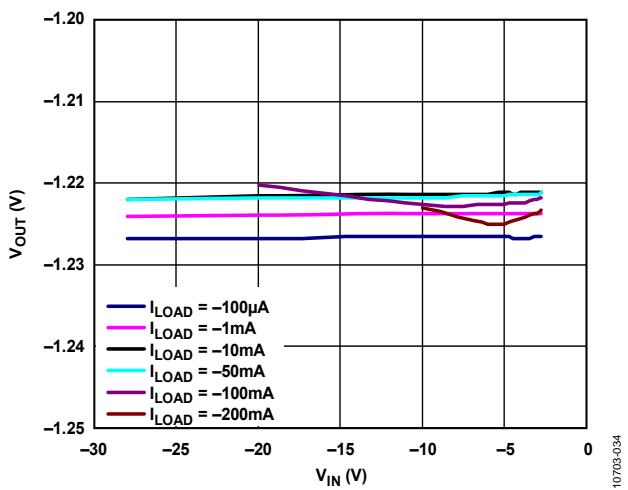
Figure 36. Output Voltage (VOUT) vs. Input Voltage (VIN), VOUT = −1.22 V

Figure 34. Output Voltage (VOUT) vs. Junction Temperature (TJ), $V _ { O U T } = - 1 . 2 2 V$

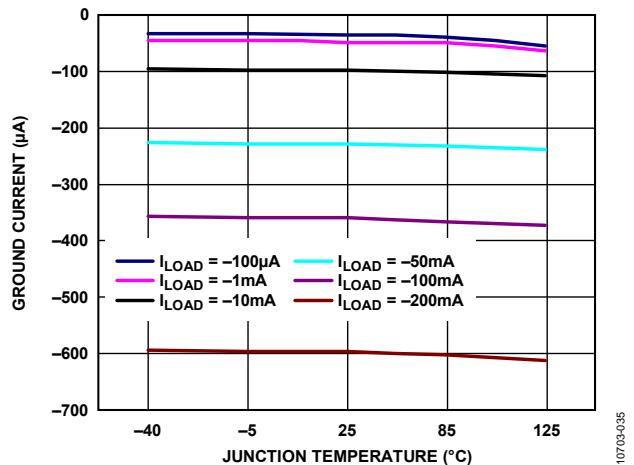
Figure 37. Ground Current vs. Junction Temperature (TJ), $V _ { O U T } = - 1 . 2 2 V$
Figure 35. Output Voltage (VOUT) vs. Load Current (ILOAD), $V _ { O U T } = - 1 . 2 2 V$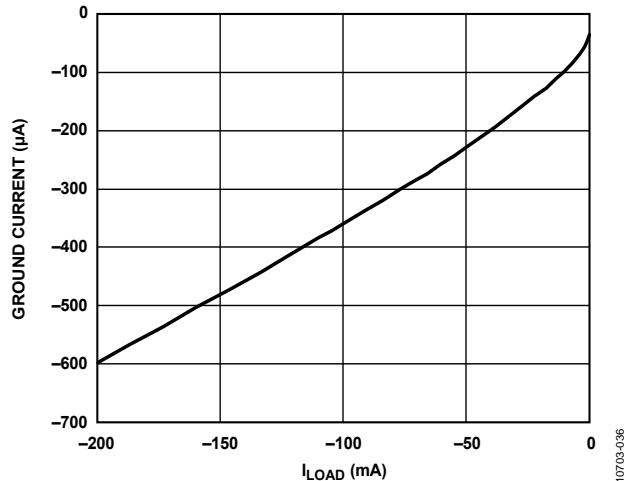
Figure 38. Ground Current vs. Load Current (ILOAD), $V _ { O U T } = - 1 . 2 2 V$

Figure 39. Ground Current vs. Input Voltage (VIN), VOUT = −1.22 V
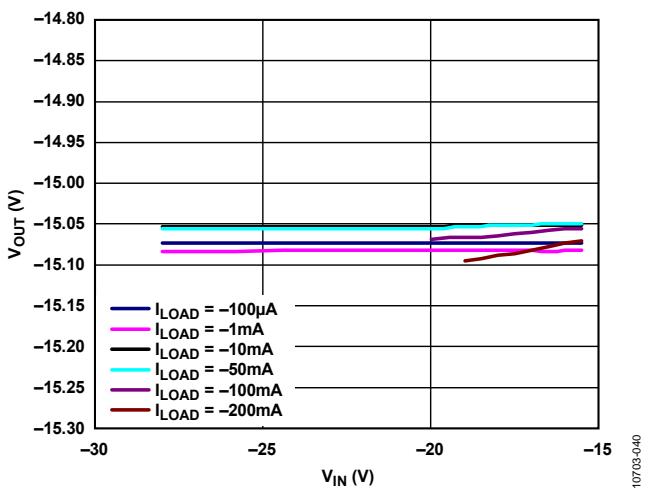
Figure 42. Output Voltage (VOUT) vs. Input Voltage (VIN), Adjustable Output Voltage, VOUT = −15 V

Figure 40. Output Voltage (VOUT) vs. Junction Temperature (TJ), Adjustable Output Voltage, VOUT = −15 V
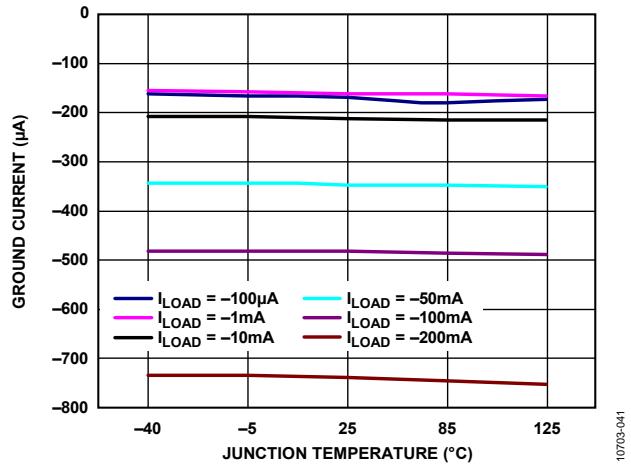
Figure 43. Ground Current vs. Junction Temperature (TJ), Adjustable Output Voltage, VOUT = −15 V
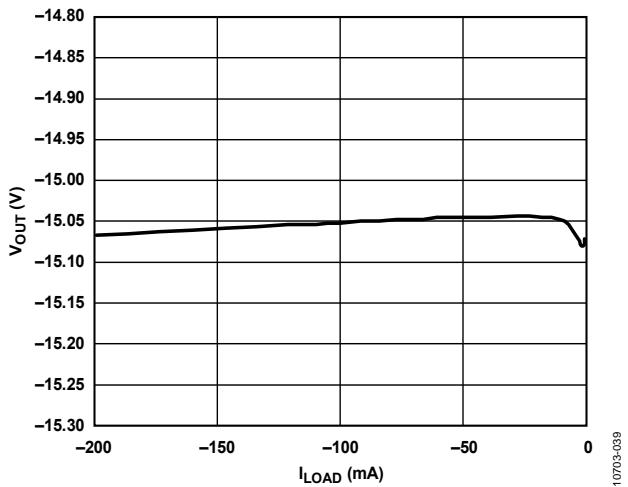
Figure 41. Output Voltage (VOUT) vs. Load Current (ILOAD), Adjustable Output Voltage, VOUT = −15 V
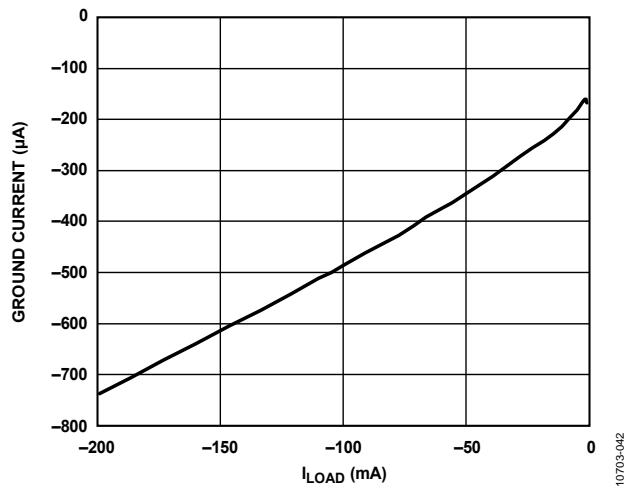
Figure 44. Ground Current vs. Load Current (ILOAD), Adjustable Output Voltage, VOUT = −15 V

Figure 45. Ground Current vs. Input Voltage (VIN), Adjustable Output Voltage, VOUT = −15 V

Figure 46. Dropout Voltage vs. Load Current (ILOAD), Adjustable Output Voltage, VOUT = −15 V
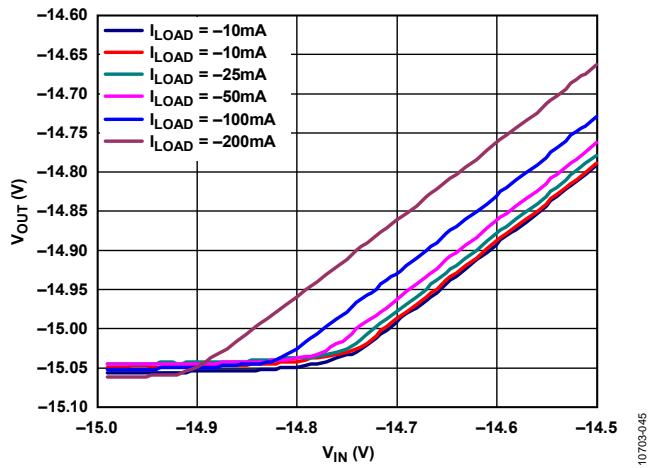
Figure 47. Output Voltage (VOUT) vs. Input Voltage (VIN) in Dropout, Adjustable Output Voltage, VOUT = −15 V
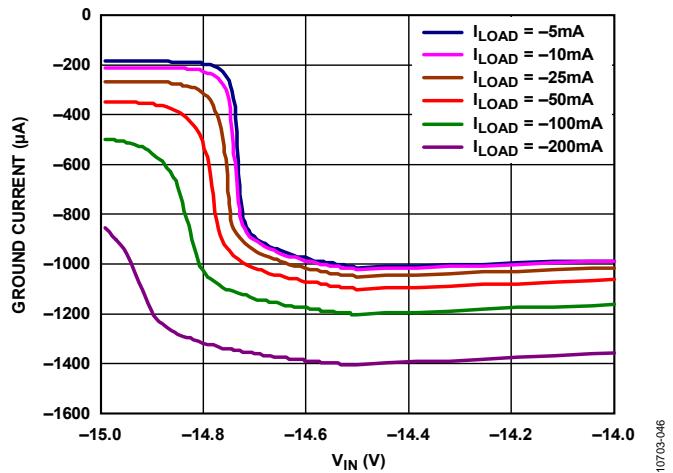
Figure 48. Ground Current vs. Input Voltage (VIN) in Dropout, VOUT = −15 V

Figure 49. Power Supply Rejection Ratio (PSRR) vs. Frequency, VOUT = −1.22 V vs. Different Load Currents (ILOAD), VIN = −2.7 V
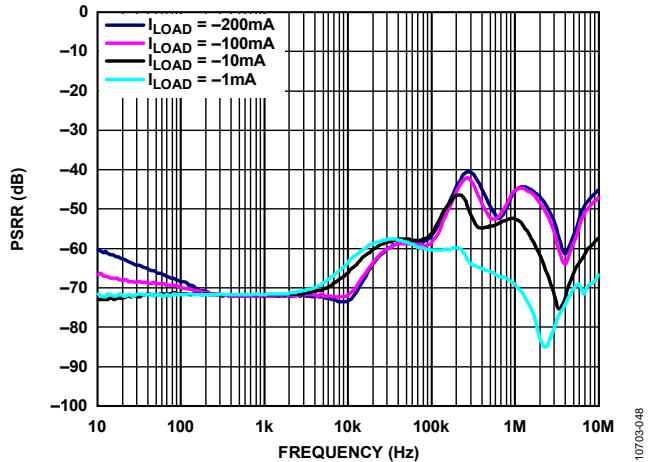
Figure 50. Power Supply Rejection Ratio (PSRR) vs. Frequency, VOUT = −1.22 V vs. Different Load Currents (ILOAD), VIN = −5.7 V

Figure 51. Power Supply Rejection Ratio (PSRR) vs. Headroom Voltage, $V _ { O U T } = - 1 . 2 2 V ,$ Load Current (ILOAD) = −200 mA
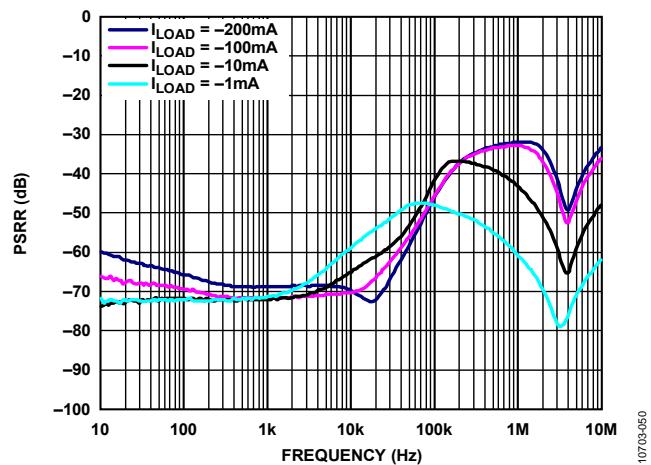
Figure 52. Power Supply Rejection Ratio (PSRR) vs. Frequency, $V _ { O U T } = - 1 . 8 V$ vs. Different Load Currents (ILOAD), $V _ { I N } = - 2 . 8 V$

Figure 53. Power Supply Rejection Ratio (PSRR) vs. Frequency, $V _ { O U T } = - 1 . 8 V v s .$ . Different Load Currents (ILOAD), $V _ { I N } = - 5 . 5 V$

Figure 54. Power Supply Rejection Ratio (PSRR) vs. Headroom Voltage, VOUT = −1.8 V, Load Current (ILOAD) = −200 mA

Figure 55. Power Supply Rejection Ratio (PSRR) vs. Frequency, $V _ { O U T } = - 3 \ V v s .$ . Different Load Currents (ILOAD), $V _ { I N } = - 4 . 0 V$
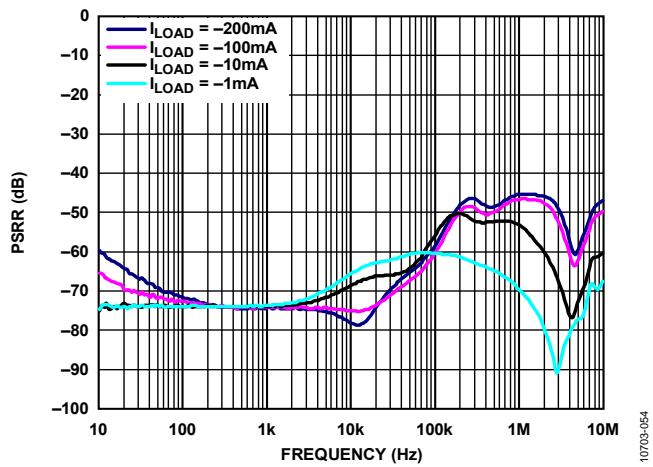
Figure 56. Power Supply Rejection Ratio (PSRR) vs. Frequency, $V _ { O U T } = - 3 \ V v s$ . Different Load Currents (ILOAD), $V _ { I N } = - 5 . 5 V$

Figure 57. Power Supply Rejection Ratio (PSRR) vs. Headroom Voltage, VOUT = −3 V, Load Current (ILOAD) = −200 mA

Figure 58. Power Supply Rejection Ratio (PSRR) vs. Frequency, Adjustable Output Voltage, VOUT = −15 V vs. Different Load Currents (ILOAD), $V _ { I N } = - 1 5 . 5$ V with Noise Reduction Network

Figure 59. Power Supply Rejection Ratio (PSRR) vs. Frequency, Adjustable Output Voltage, VOUT = −15 V vs. Different Load Currents (ILOAD), VIN = −16.5 V with Noise Reduction Network

Figure 60. Power Supply Rejection Ratio (PSRR) vs. Headroom Voltage, Adjustable Output Voltage, VOUT = −15 V with Noise Reduction Network, Load Current (ILOAD) = −200 mA

Figure 61. RMS Noise vs. Load Current (ILOAD), Various Output Voltages
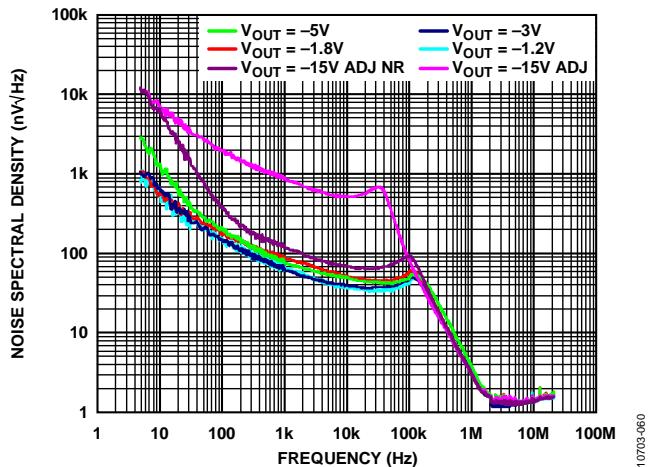
Figure 62. Noise Spectral Density, Various Output Voltages

Figure 63. Line Transient Response, 500 mV Step, VOUT = −1.22 V, ILOAD = −200 mA
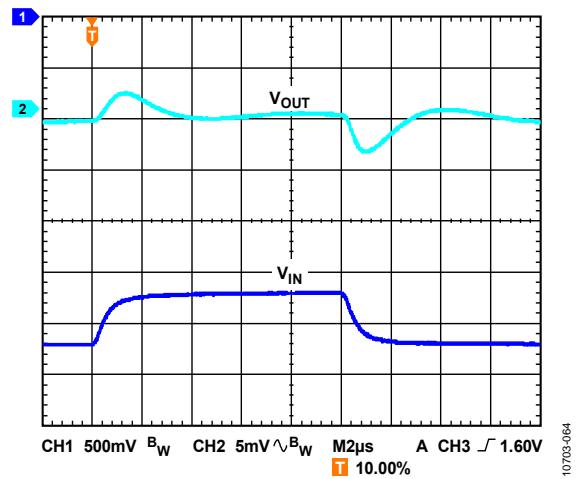
Figure 66. Line Transient Response, 500 mV Step, VOUT = −1.8 V, ILOAD = −10 mA
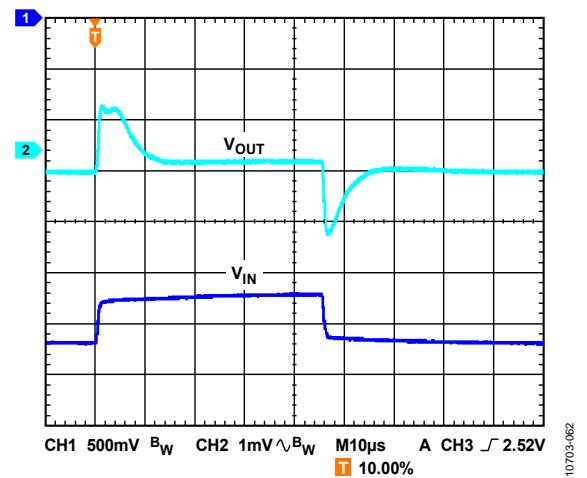
Figure 64. Line Transient Response, 500 mV Step, VOUT = −1.22 V, ILOAD = −10 mA
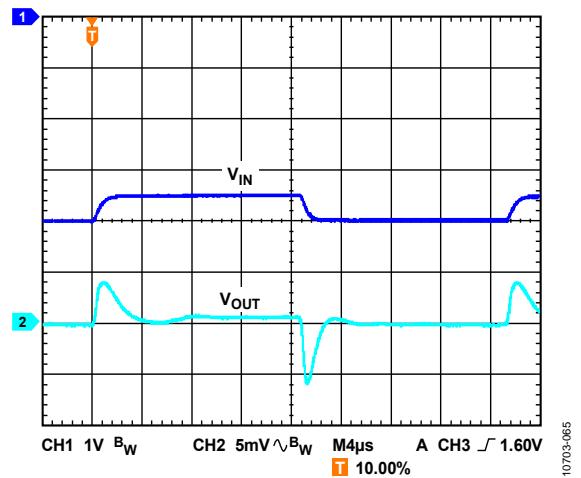
Figure 67. Line Transient Response, 500 mV Step, VOUT = −3 V, ILOAD = −200 mA
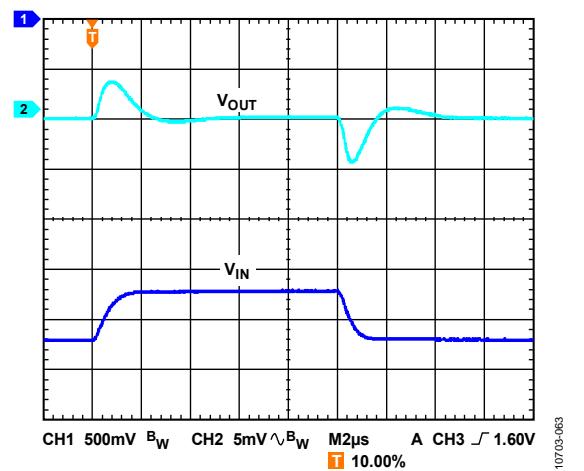
Figure 65. Line Transient Response, 500 mV Step, VOUT = −1.8 V, ILOAD = −200 mA
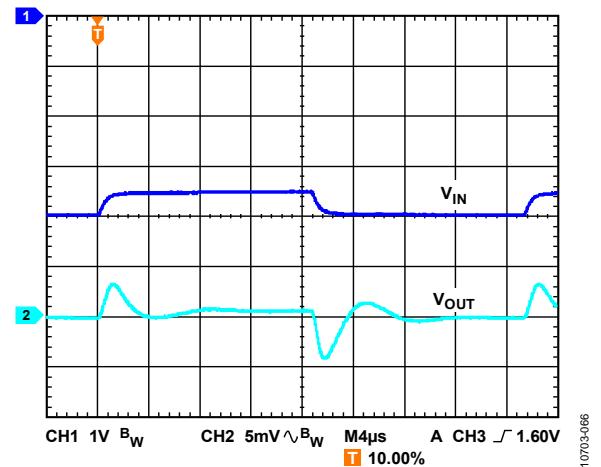
Figure 68. Line Transient Response, 500 mV Step, VOUT = −3 V, ILOAD = −10 mA

Figure 69. Line Transient Response, 500 mV Step, $V _ { O U T } = - 5 V , I _ { L O A D } = - 2 0 0 m A$

Figure 70. Line Transient Response, 500 mV Step, $V _ { O U T } = - 5 V , I _ { L O A D } = - 1 0 m A$

Figure 71. Line Transient Response, 500 mV Step, $V _ { O U T } = - 1 5 V ,$ Noise Reduction Network, I = −200 mA

Figure 72. Line Transient Response, 500 mV Step, VOUT = −15 V, Noise Reduction Network, ILOAD = −10 mA

Figure 73. Load Transient Response, VOUT = −1.22 V, ILOAD = −1 mA to −200 mA, Load Step = 1 A/μs

Figure 74. Load Transient Response, VOUT = −3 V, ILOAD = −1 mA to −200 mA, Load Step = 1 A/μs
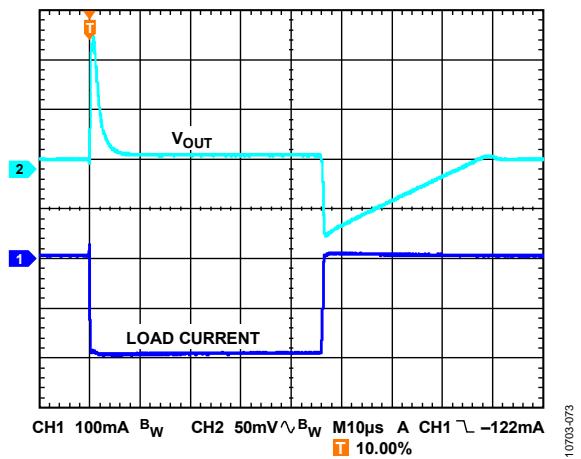
Figure 75. Load Transient Response, VOUT = −5 V, ILOAD = −1 mA to −200 mA, Load Step = 1 A/μs
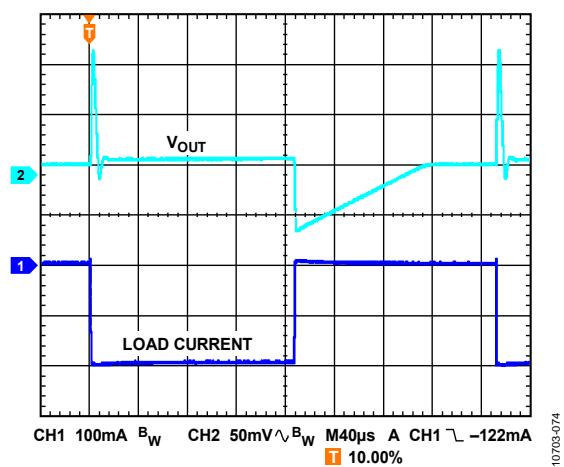
Figure 76. Load Transient Response, VOUT = −15 V, ILOAD = −1 mA to −200 mA, Load Step = 1 A/μs, Noise Reduction Network
THEORY OF OPERATION
The ADP7182 is a low quiescent current, LDO linear regulator that operates from −2.7 V to −28 V and can provide up to −200 mA of output current. Drawing a low −650 μA of quiescent current (typical) at full load makes the ADP7182 ideal for battery-powered portable equipment. Maximum shutdown current consumption is −8 μA at room temperature.
Optimized for use with small 2.2 μF ceramic capacitors, the ADP7182 provides excellent transient performance.
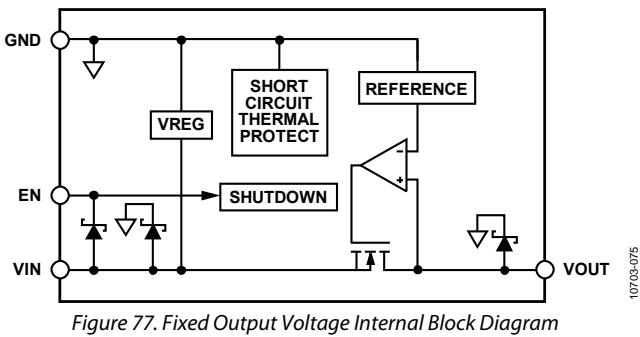
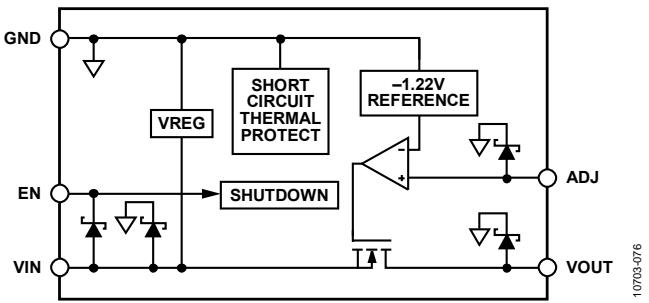
Figure 78. Adjustable Output Voltage Internal Block Diagram
Internally, the ADP7182 consists of a reference, an error amplifier, a feedback voltage divider, and an NMOS pass transistor. Output current is delivered via the NMOS pass transistor, which is controlled by the error amplifier. The error amplifier compares the reference voltage with the feedback voltage from the output and amplifies the difference. If the feedback voltage is more positive than the reference voltage, the gate of the NMOS transistor is pulled toward GND, allowing more current to pass and increasing the output voltage. If the feedback voltage is more negative than the reference voltage, the gate of the NMOS transistor is pulled toward $- \mathrm { V } _ { \mathrm { I N } } ,$ allowing less current to pass and decreasing the output voltage.
The ESD protection devices are shown in the block diagram as Zener diodes (see Figure 77 and Figure 78).
ADJUSTABLE MODE OPERATION
The ADP7182 is available in a fixed output voltage and an adjustable mode version with an output voltage that can be set to between −1.22 V and −27 V by an external voltage divider. The output voltage can be set according to
$$
- V _ {O U T} = - 1. 2 2 \mathrm{V} \left(1 + R _ {F B 1} / R _ {F B 2}\right)
$$
where $\mathrm { R } _ { \mathrm { F B 1 } }$ and $\mathrm { R } _ { \mathrm { F B } 2 }$ are the resistors in the output voltage divider, as shown in Figure 79.
RFB2 must be less than 120 kΩ to minimize the output voltage errors due to the leakage current of the ADJ pin. The error voltage caused by the ADJ pin leakage current is the parallel combination of RFB and RFB2 times the ADJ pin leakage current.
For example, when $\mathrm { R } _ { \mathrm { F B } 1 } = \mathrm { R } _ { \mathrm { F B } 2 } = 1 2 0$ kΩ, the output voltage is −2.44 V and the error due to the typical ADJ pin leakage current (10 nA) is 60 kΩ times 10 nA, or 0.6 mV. This example results in an output voltage error of 0.0245%.
The addition of a small capacitor (~100 pF) in parallel with RFB1 can improve the stability of the ADP7182. Larger values of capacitance also reduce the noise and improve PSRR (see the Noise Reduction of the Adjustable section).

Figure 79. Setting Adjustable Output Voltage
APPLICATIONS INFORMATION
ADIsimPower DESIGN TOOL
The ADP7182 is supported by the ADIsimPower™ design tool set. ADIsimPower is a collection of tools that produce complete power designs optimized for a specific design goal. The tools enable the user to generate a full schematic, bill of materials, and calculate performance in minutes. ADIsimPower can optimize designs for cost, area, efficiency, and devices count taking into consideration the operating conditions and limitations of the IC and all real external components. For more information about, and to obtain ADIsimPower design tools, visit www.analog.com/ADIsimPower.
CAPACITOR SELECTION
Output Capacitor
The ADP7182 is designed for operation with small space-saving ceramic capacitors; however, it functions with most commonly used capacitors as long as care is taken with regard to the ESR value. The ESR of the output capacitor affects the stability of the LDO control loop. A minimum of 2.2 μF capacitance with an ESR of 0.2 Ω or less is recommended to ensure the stability of the ADP7182. Transient response to changes in load current is also affected by output capacitance. Using a larger value of output capacitance improves the transient response of the ADP7182 to large changes in load current. Figure 80 shows the transient responses for an output capacitance value of 2.2 μF.

Figure 80. Output Transient Response, COUT = 2.2 μF
Input Bypass Capacitor
Connecting a 2.2 μF capacitor from VIN to GND reduces the circuit sensitivity to PCB layout, especially when long input traces or high source impedance are encountered. When more than 2.2 μF of output capacitance is required, increase the input capacitance to match it.
Input and Output Capacitor Properties
As long as they meet the minimum capacitance and maximum ESR requirements, any good quality ceramic capacitors can be used with the ADP7182. Ceramic capacitors are manufactured with a variety of dielectrics, each with different behavior over temperature and applied voltage.
Capacitors must have a dielectric adequate to ensure the minimum capacitance over the necessary temperature range and dc bias conditions. X5R or X7R dielectrics with a voltage rating of 25 V or 50 V are recommended. Due to their poor temperature and dc bias characteristics, Y5V and Z5U dielectrics are not recommended.
Figure 81 depicts the capacitance vs. voltage bias characteristics of a 0805, 2.2 μF, 25 V, X5R capacitor. The voltage stability of a capacitor is strongly influenced by the capacitor size and voltage rating. In general, a capacitor in a larger package or higher voltage rating exhibits better stability. The temperature variation of the X5R dielectric is ~ ±15% over the −40°C to +85°C temperature range and is not a function of package or voltage rating.
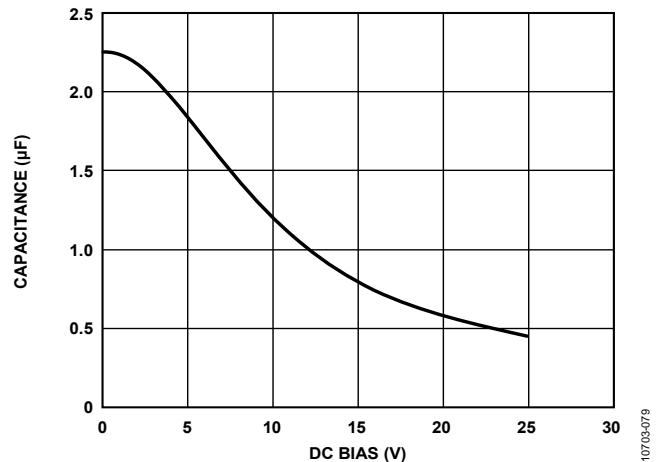
Figure 81. Capacitance vs. DC Bias Characteristics
Use Equation 1 to determine the worst-case capacitance accounting for capacitor variation over temperature, component tolerance, and voltage.
$$
C _ {E F F} = C _ {B I A S} \times (1 - T E M P C O) \times (1 - T O L)\tag{1}
$$
where:
CBIAS is the effective capacitance at the operating voltage, which is −3 V for this example.
TEMPCO is the worst-case capacitor temperature coefficient. TOL is the worst-case component tolerance.
In this example, the worst-case temperature coefficient (TEMPCO) over −40°C to +85°C is 15% for an X5R dielectric. The tolerance of the capacitor (TOL) is 10%, and the CBIAS is 2.08 μF at a 3 V bias, as shown in Figure 81.
Substituting these values in Equation 1 yields
$$
C _ {E F F} = 2. 0 8 \mu \mathrm{F} \times (1 - 0. 1 5) \times (1 - 0. 1) = 1. 5 9 \mu \mathrm{F}
$$
Therefore, the capacitor chosen in this example meets the minimum capacitance requirement of the LDO over temperature and tolerance at the chosen output voltage of −3 V.
To guarantee the performance of the ADP7182, it is imperative that the effects of dc bias, temperature, and tolerances on the behavior of the capacitors be evaluated for each application.
ENABLE PIN OPERATION
The ADP7182 uses the EN pin to enable and disable the VOUT pin under normal operating conditions. When EN is at ±2 V with respect to GND, VOUT turns on, and when EN is at 0 V, VOUT turns off. For automatic startup, EN can be connected to VIN. When the device is disabled, a ~220 kΩ resistor connects to the VOUT pin, which pulls the VOUT pin up to GND.
The ADP7182 provides a dual polarity enable pin (EN) that turns on the LDO when |VEN| ≥ 2 V. The enable voltage can be positive or negative with respect to ground.

Figure 82. Typical EN Pin Operation
Figure 82 shows the typical hysteresis of the EN pin. This prevents on/off oscillations that can occur due to noise on the EN pin as it passes through the threshold points.
Figure 83 shows typical EN thresholds when the input voltage varies from −2.7 V to −28 V.

Figure 83. Typical EN Pin Thresholds vs. Input Voltage
Figure 84 and Figure 85 show the start-up behavior for a −5 V output with positive and negative going enable signals.
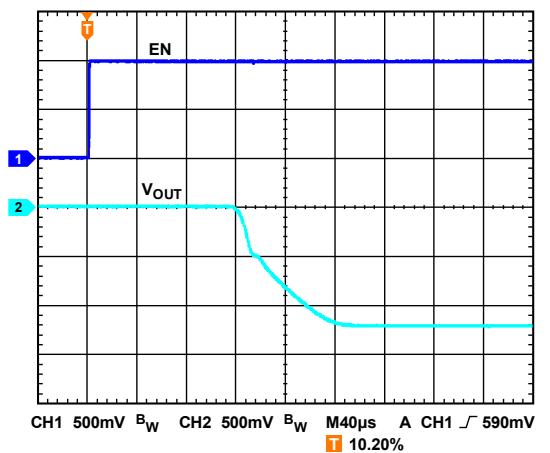
Figure 84. Typical Start-Up Behavior, Positive Going Enable

Figure 85. Typical Start-Up Behavior, Negative Going Enable
SOFT START
The ADP7182 uses an internal soft start to limit the inrush current when the output is enabled. The start-up time for the −5 V option is approximately 450 μs from the time the EN active threshold is crossed to when the output reaches 90% of the final value. As shown in Figure 86, the start-up time is dependent on the output voltage setting.
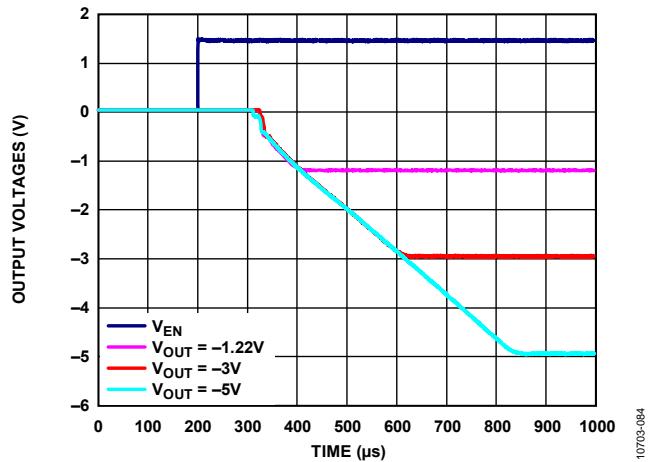
Figure 86. Typical Start-Up Behavior, Different Output Voltages
NOISE REDUCTION OF THE ADJUSTABLE ADP7182
The ultralow output noise of the fixed output ADP7182 is achieved by keeping the LDO error amplifier in unity gain and setting the reference voltage equal to the output voltage. This architecture does not work for an adjustable output voltage LDO. The adjustable output ADP7182 uses the more conventional architecture where the reference voltage is fixed and the error amplifier gain is a function of the output voltage. The disadvantage of the conventional LDO architecture is that the output voltage noise is proportional to the output voltage.
The adjustable LDO circuit can be modified slightly to reduce the output voltage noise to levels close to that of the fixed output of the ADP7182. The circuit shown in Figure 87 adds two additional components to the output voltage setting resistor divider. CNR and RNR are added in parallel with RFB1 to reduce the ac gain of the error amplifier. RNR is chosen to be nearly equal to RFB2; this limits the ac gain of the error amplifier to approximately 6 dB. The actual gain is the parallel combination of RNR and RFB1 divided by RFB2. This resistance ensures that the error amplifier always operates at greater than unity gain.
CNR is chosen by setting the reactance of CNR equal to $\mathrm { R } _ { \mathrm { F B 1 } } - \mathrm { R } _ { \mathrm { N R } }$ at a frequency between 10 Hz and 100 Hz. This capacitance sets the frequency where the ac gain of the error amplifier is 3 dB down from the dc gain.

Figure 87. Noise Reduction Modification to Adjustable LDO
The noise of the adjustable LDO is found by using the following formula, assuming the noise of a fixed output LDO is approximately $1 8 \mu \mathrm { V } ;$
$$
\text { Noise } = 1 8 \mu \mathrm{V} \times \left(R _ {P A R} + R _ {F B 2}\right) \div R _ {F B 2}
$$
where RPAR is a parallel combination of $R _ { F B I }$ and $R _ { N R } .$ .
Based on the component values shown in Figure 87, the ADP7182 has the following characteristics:
DC gain of 12.3 (21.8 dB)
3 dB roll-off frequency of 10.8 Hz
High frequency ac gain of 1.92 (5.67 dB)
Noise reduction factor of 6.41 (16.13 dB)
Measured rms noise of the adjustable LDO at −200 mA without noise reduction of 220 μV rms
Measured rms noise of the adjustable LDO at −200 mA with noise reduction circuit of 35 $\mu \mathrm { V }$ rms
Calculated rms noise of the adjustable LDO with noise reduction (assuming 18 $\mu \mathrm { V }$ rms for fixed voltage option) of 34.5 μV rms
The noise of the LDO is approximately the noise of the fixed output LDO (typically $1 8 \mu \mathrm { V }$ rms) times the high frequency ac gain. The following equation shows the calculation with the values shown in Figure 87.
$$
1 8 \mu \mathrm{V} \times \left(1 + \left(\frac {1}{1 / 1 3 \mathrm{k} \Omega + 1 / 1 4 7 \mathrm{k} \Omega}\right) / 1 3 \mathrm{k} \Omega\right)\tag{2}
$$
Figure 88 shows the difference in noise spectral density for the adjustable ADP7182 set to −15 V with and without the noise reduction network. In the 100 Hz to 30 kHz frequency range, the reduction in noise is significant.
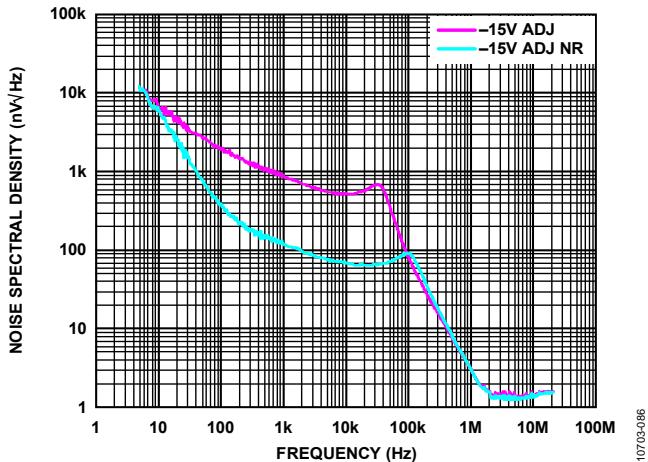
Figure 88. −15 V Adjustable ADP7182 with and without the Noise Reduction Network (CNR and RNR)
CURRENT-LIMIT AND THERMAL OVERLOADPROTECTION
The ADP7182 is protected against damage due to excessive power dissipation by current-limit and thermal overload protection circuits. The ADP7182 is designed to limit current when the output load reaches −350 mA (typical). When the output load exceeds −350 mA, the output voltage is reduced to maintain a constant current limit.
Thermal overload protection is included, which limits the junction temperature to a maximum of 150°C (typical). Under extreme conditions (that is, high ambient temperature and power dissipation) when the junction temperature starts to rise above 150°C, the output is turned off, reducing the output current to 0 mA. When the junction temperature falls below 135°C, the output is turned on again, and the output current is restored to the nominal value.
Consider the case where a hard short from VOUT to ground occurs. At first, the ADP7182 limits current so that only −350 mA is conducted into the short. If self-heating of the junction is great enough to cause the temperature to rise above 150°C, thermal shutdown is activated, turning off the output and reducing the output current to 0 mA. As the junction temperature cools and falls below $1 3 5 ^ { \circ } \mathrm { C } ,$ the output turns on and conducts −350 mA into the short, again causing the junction temperature to rise above 150°C. This thermal oscillation between 135°C and 150°C causes a current oscillation between −350 mA and 0 mA that continues as long as the short remains at the output.
Current-limit and thermal overload protections are intended to protect the device against accidental overload conditions. For reliable operation, device power dissipation must be externally limited so that the junction temperatures do not exceed $1 2 5 ^ { \circ } \mathrm { C }$
THERMAL CONSIDERATIONS
In most applications, the ADP7182 does not dissipate much heat due to the high efficiency. However, in applications with high ambient temperature, and high supply voltage to output voltage differential, the heat dissipated in the package is large enough that it can cause the junction temperature of the die to exceed the maximum junction temperature of 125°C.
When the junction temperature exceeds 150°C, the converter enters thermal shutdown. It recovers only after the junction temperature has decreased below 135°C to prevent any permanent damage. Therefore, thermal analysis for the chosen application is important to guarantee reliable performance over all conditions. The junction temperature of the die is the sum of the ambient temperature of the environment and the temperature rise of the package due to the power dissipation, as shown in Equation 3.
To guarantee reliable operation, the junction temperature of the ADP7182 must not exceed $1 2 5 ^ { \circ } \mathrm { C } .$ To ensure that the junction temperature stays below this maximum value, the user must be aware of the parameters that contribute to junction temperature changes. These parameters include ambient temperature, power dissipation in the power device, and thermal resistances between the junction and ambient air $( \theta _ { \mathrm { J A } } )$ . The $\theta _ { \mathrm { J A } }$ number is dependent on the package assembly compounds that are used, and the amount of copper that solders the package VIN pins to the PCB.
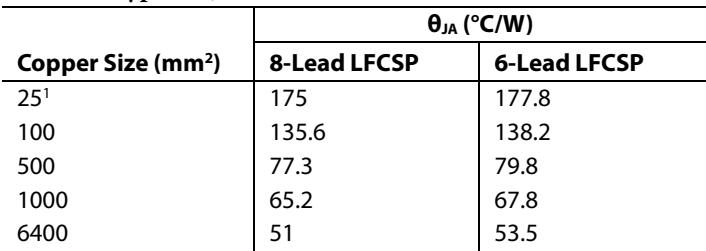
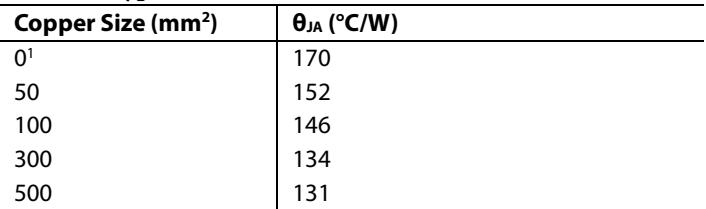
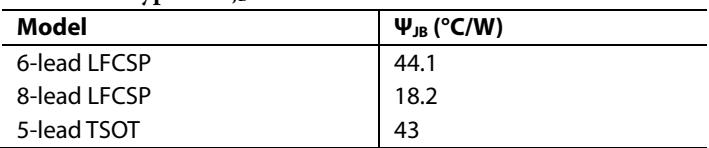
Table 8 and Table 9 show typical $\theta _ { \mathrm { J A } }$ values of the 6- and 8-lead and 5-lead TSOT packages for various PCB copper sizes. Table 10 shows the typical $\Psi _ { \mathrm { J B } }$ values of the 6- and 8-lead and 5-lead TSOT.
Table 8. Typical ${ \bf \theta _ { \mathrm { { J A } } } }$ Values of the LFCSP
| Copper Size (mm2) | $\theta_{JA}$ (°C/W) | |
| 8-Lead LFCSP | 6-Lead LFCSP | |
| 251 | 175 | 177.8 |
| 100 | 135.6 | 138.2 |
| 500 | 77.3 | 79.8 |
| 1000 | 65.2 | 67.8 |
| 6400 | 51 | 53.5 |
1 Device soldered to minimum size pin traces.
Table 9. Typical ${ \displaystyle { \bf \theta } _ { { \bf J } { \bf A } } }$ Values of the 5-Lead TSOT
| Copper Size (mm2) | $\theta_{JA}$ (°C/W) |
| 01 | 170 |
| 50 | 152 |
| 100 | 146 |
| 300 | 134 |
| 500 | 131 |
1 Device soldered to minimum size pin traces.
Table 10. Typical $\Psi _ { \mathrm { J B } }$ Values
| Model | $\Psi_{JB}$ (°C/W) |
| 6-lead LFCSP | 44.1 |
| 8-lead LFCSP | 18.2 |
| 5-lead TSOT | 43 |
The junction temperature of the ADP7182 can be calculated by
$$
T _ {J} = T _ {A} + (P _ {D} \times \theta_ {J A})\tag{3}
$$
where:
$T _ { A }$ is the ambient temperature.
$P _ { D }$ is the power dissipation in the die, given by
$$
P _ {D} = \left[ \left(V _ {I N} - V _ {O U T}\right) \times I _ {L O A D} \right] + \left(V _ {I N} \times I _ {G N D}\right)\tag{4}
$$
where:
VIN and VOUT are the input and output voltages, respectively. ILOAD is the load current.
IGND is the ground current.
Power dissipation due to ground current is quite small and can be ignored. Therefore, the junction temperature equation simplifies to
$$
T _ {J} = T _ {A} + \left{\left[ (V _ {I N} - V _ {O U T}) \times I _ {L O A D} \right] \times \theta_ {J A} \right}\tag{5}
$$
As shown in Equation 5, for a given ambient temperature, input-tooutput voltage differential, and continuous load current, there exists a minimum copper size requirement for the PCB to ensure that the junction temperature does not rise above $1 2 5 ^ { \circ } \mathrm { C } .$ Figure 89 to Figure 97 show junction temperature calculations for different ambient temperatures, power dissipation, and areas of PCB copper.
Heat dissipation from the package can be improved by increasing the amount of copper attached to the pins of the ADP7182.
Adding thermal planes under the package also improves thermal performance. However, as listed in Table 8 and Table 9, a point of diminishing returns is reached eventually, beyond which an increase in the copper area does not yield significant reduction in the junction-to-ambient thermal resistance.
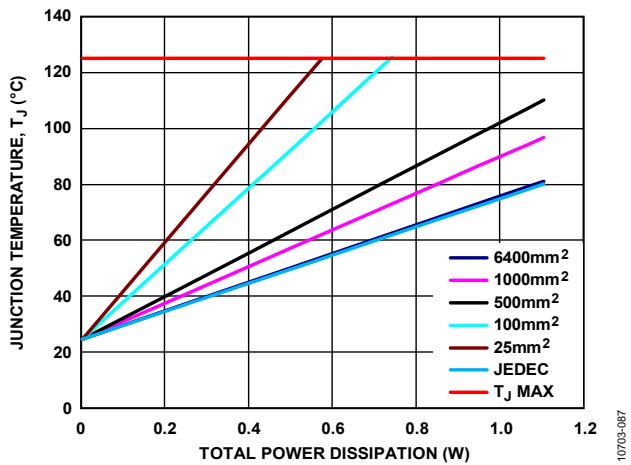
Figure 89. Junction Temperature vs. Total Power Dissipation for the 8-Lead LFCSP, $T _ { A } = 2 5 ^ { \circ } C$

Figure 90. Junction Temperature vs. Total Power Dissipation for the 8-Lead LFCSP, TA = 50°C
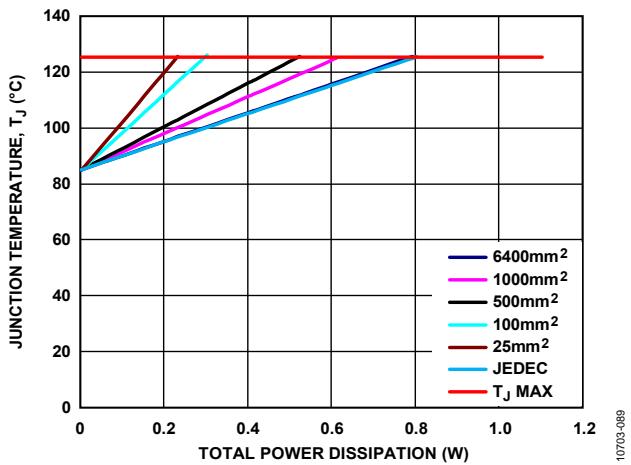
Figure 91. Junction Temperature vs. Total Power Dissipation for the 8-Lead LFCSP, TA = 85°C
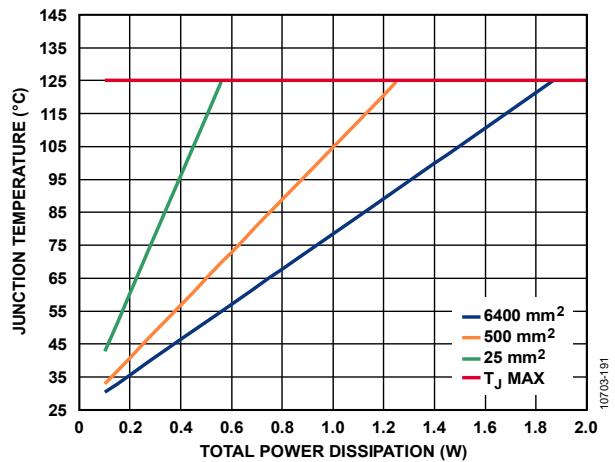
Figure 92. Junction Temperature vs. Total Power Dissipation for the 6-Lead LFCSP, T = 25°C
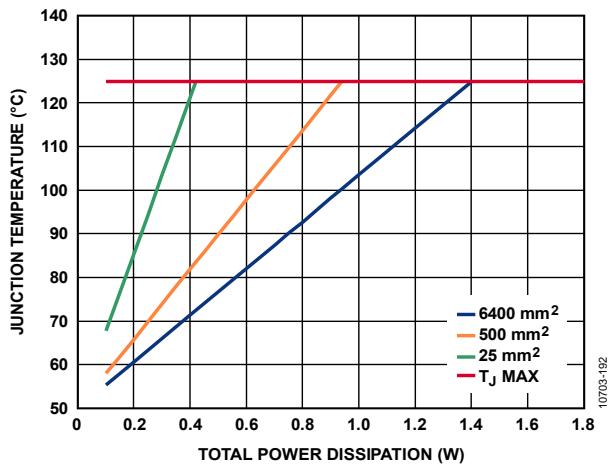
Figure 93. Junction Temperature vs. Total Power Dissipation for the 6-Lead LFCSP, T = 50°C
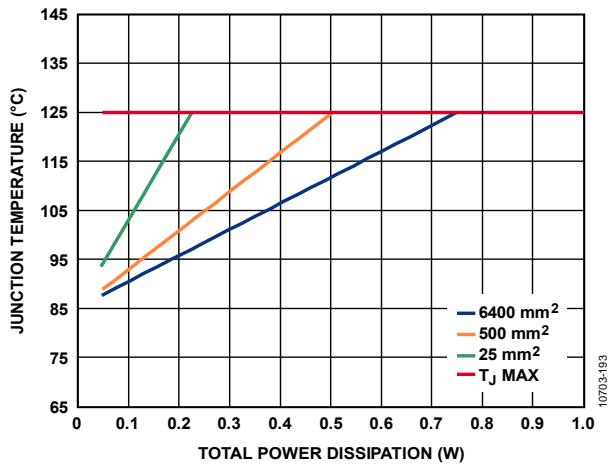
Figure 94. Junction Temperature vs. Total Power Dissipation for the 6-Lead LFCSP, T = 85°C
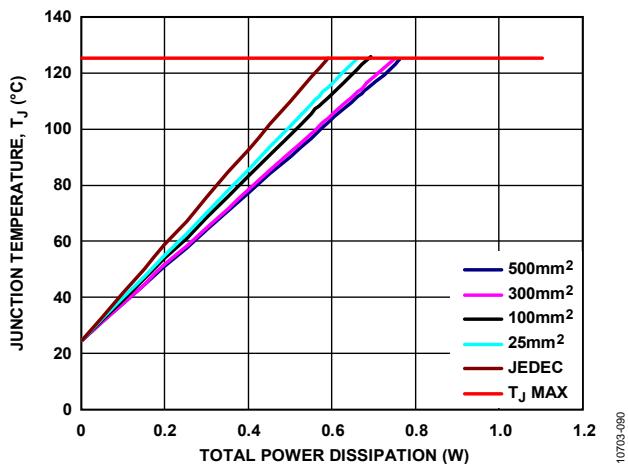
Figure 95. Junction Temperature vs. Total Power Dissipation for the 5-Lead TSOT, T = 25°C
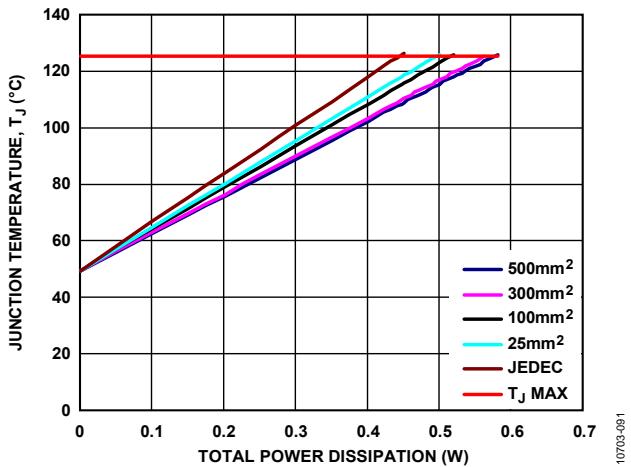
Figure 96. Junction Temperature vs. Total Power Dissipation for the 5-Lead TSOT, $T _ { A } = 5 0 ^ { \circ } C$

Figure 97. Junction Temperature vs. Total Power Dissipation for the 5-Lead TSOT, ${ T _ { A } = 8 5 ^ { \circ } C }$
Thermal Characterization Parameter, $\psi _ { J B }$
When the board temperature is known, use the thermal characterization parameter, $\Psi _ { \mathrm { J B } } ,$ to estimate the junction temperature rise (see Figure 98 and Figure 100). Maximum junction temperature (TJ) is calculated from the board temperature (TB) and power dissipation (PD) using the following formula:
$$
T _ {J} = T _ {B} + \left(P _ {D} \times \Psi_ {J B}\right)\tag{6}
$$
The typical value of $\Psi _ { \mathrm { { J B } } }$ is 18.2°C/W for the 8-lead LFCSP package, 44.1°C/W for the 6-lead LFCSP package and $4 3 ^ { \circ } \mathrm { C } / \mathrm { W }$ for the 5-lead TSOT package.
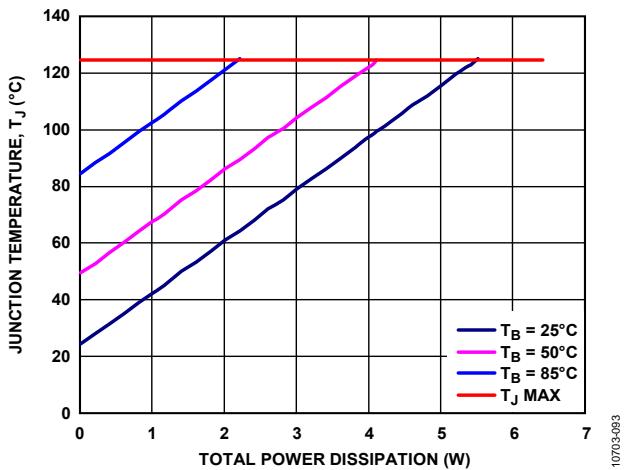
Figure 98. Junction Temperature vs. Total Power Dissipation for the 8-Lead LFCSP, ${ T _ { A } = 8 5 ^ { \circ } C }$
Figure 99. Junction Temperature vs. Total Power Dissipation for the 6-Lead LFCSP, ${ T _ { A } } = 8 5 ^ { \circ } C$
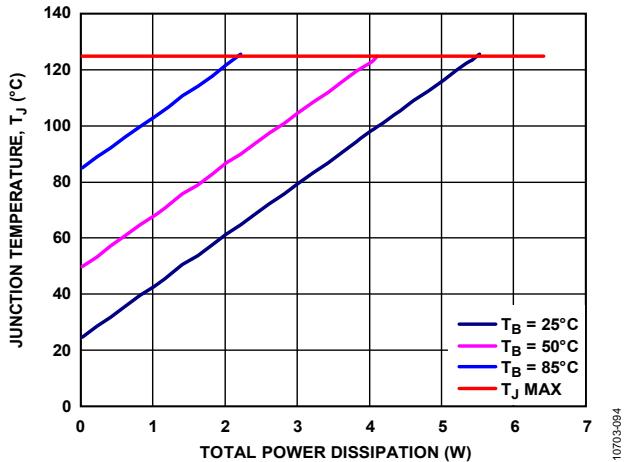
Figure 100. Junction Temperature vs. Total Power Dissipation for the 5-Lead TSOT, ${ T _ { A } = 8 5 ^ { \circ } C }$
Data Sheet
PCB LAYOUT CONSIDERATIONS
Place the input capacitor as close as possible to the VIN and GND pins. Place the output capacitor as close as possible to the VOUT and GND pins. Use of 1206 or 0805 size capacitors and resistors achieves the smallest possible footprint solution on boards where area is limited.

Figure 101. Example of the 6-Lead LFCSP PCB Layout

Figure 102. Example of the 8-Lead LFCSP PCB Layout

Figure 103. Example of the 5-Lead TSOT PCB Layout
Table 11. Recommended LDOs for Very Low Noise Operation
| Device Number | $V_{IN}$ Range (V) | $V_{OUT}$ Fixed (V) | $V_{OUT}$ Adjust (V) | $I_{OUT}$ (mA) | $I_Q$ at $I_{OUT}$ (μA) | $I_{GND-SD}$ Max (μA) | Soft Start | $P_{GOOD}$ | Noise (Fixed) 10 Hz to 100 kHz (μV rms) | PSRR 100 kHz (dB) | PSRR 1 MHz (dB) | Package |
| ADP7102 | 3.3 to 20 | 1.5 to 9 | 1.22 to 19 | 300 | 750 | 75 | No | Yes | 15 | 60 | 40 | 3 mm × 3 mm8-lead LFCSP,8-lead SOIC |
| ADP7104 | 3.3 to 20 | 1.5 to 9 | 1.22 to 19 | 500 | 900 | 75 | No | Yes | 15 | 60 | 40 | 3 mm × 3 mm8-lead LFCSP,8-lead SOIC |
| ADP7105 | 3.3 to 20 | 1.8, 3.3, 5 | 1.22 to 19 | 500 | 900 | 75 | Yes | Yes | 15 | 60 | 40 | 3 mm × 3 mm8-lead LFCSP,8-lead SOIC |
| ADP7118 | 2.7 to 20 | 1.2 to 5 | 1.2 to 19 | 200 | 160 | 10 | Yes | No | 11 | 68 | 50 | 2 mm × 2 mm6-lead LFCSP,8-lead SOIC,5-lead TSOT |
| ADP7142 | 2.7 to 40 | 1.2 to 5 | 1.2 to 39 | 200 | 160 | 10 | Yes | No | 11 | 68 | 50 | 2 mm × 2 mm6-lead LFCSP,8-lead SOIC,5-lead TSOT |
| ADP7182 | -2.7 to -28 | -1.8 to -5 | -1.22 to -27 | -200 | -650 | -8 | No | No | 18 | 45 | 45 | 2 mm × 2 mm6-lead LFCSP,3 mm × 3 mm8-lead LFCSP,5-lead TSOT |
Figure 104. 6-Lead Lead Frame Chip Scale Package [LFCSP] 2.00 mm × 2.00 mm Body and 0.55 Package Height (CP-6-3)
OUTLINE DIMENSIONS

2 For additional voltage options, contact a local Analog Devices, Inc., sales or distribution representative.
Dimensions shown in millimeters

COMPLIANT TO JEDEC STANDARDS MO-193-AB
Figure 106. 5-Lead Thin Small Outline Transistor Package [TSOT] (UJ-5)
ORDERING GUIDE
| Model1 | Temperature Range | Output Voltage (V)2 | Package Description | Package Option | Marking Code |
| ADP7182ACPZ-R7 | -40°C to +125°C | Adjustable | 8-Lead LFCSP | CP-8-13 | LN6 |
| ADP7182ACPZ-5.0-R7 | -40°C to +125°C | -5 | 8-Lead LFCSP | CP-8-13 | LN9 |
| ADP7182AUJZ-R7 | -40°C to +125°C | Adjustable | 5-Lead TSOT | UJ-5 | LN6 |
| ADP7182AUJZ-1.8-R7 | -40°C to +125°C | -1.8 | 5-Lead TSOT | UJ-5 | LN1 |
| ADP7182AUJZ-2.5-R7 | -40°C to +125°C | -2.5 | 5-Lead TSOT | UJ-5 | LN7 |
| ADP7182AUJZ-3.0-R7 | -40°C to +125°C | -3 | 5-Lead TSOT | UJ-5 | LN2 |
| ADP7182AUJZ-5.0-R7 | -40°C to +125°C | -5 | 5-Lead TSOT | UJ-5 | LN9 |
| ADP7182ACPZN-R7 | -40°C to +125°C | Adjustable | 6-Lead LFCSP | CP-6-3 | LN6 |
| ADP7182ACPZN-5.0R7 | -40°C to +125°C | -5 | 6-Lead LFCSP | CP-6-3 | LN9 |
| ADP7182ACPZN-2.5R7 | -40°C to +125°C | -2.5 | 6-Lead LFCSP | CP-6-3 | LN7 |
| ADP7182ACPZN-1.5R7 | -40°C to +125°C | -1.5 | 6-Lead LFCSP | CP-6-3 | LQK |
| ADP7182ACPZN-1.2R7 | -40°C to +125°C | -1.2 | 6-Lead LFCSP | CP-6-3 | LRE |
| ADP7182UJ-EVALZ | Evaluation Board, TSOT | ||||
| ADP7182CP-EVALZ | Evaluation Board, LFCSP |
1 Z = RoHS Compliant Part.
Figures and diagrams from the PDF
Preview the extracted datasheet assets and open any image in a separate tab for closer inspection.


Use this datasheet from any agent
Send the page, markdown, chunks, or search endpoint to ChatGPT, Claude, embedr-app, or your own tooling.